The past several days have been quite tumultuous for the GBPUSD, in light of the reinstated lockdowns in England, and the entry of the final stage of the Presidential race in the US. Even so, the next five days are poised to be even more volatile for the cable. What follows next in the economic calendar is arguably the most eventful week for the entire 2020 with BOE and FED's interest rate decisions; Non-Farm Payrolls in the US; and of course, to top it all off – tomorrow's election date that the market has been bracing for over the last several months.
With so many top-tier events cramped over the span of just several days, adverse volatility and general market uncertainty are bound to reach critical levels. For more risk-averse traders, such a tight calendar ahead would spell massive risk, which could discourage them from joining the market at the height of all of this uncertainty. Even still, that is not to say that the GBPUSD is behaving quite erratically.
As regards the pound, the renewed lockdown measures in large swaths of the United Kingdom would stave off the overall economic activity, and just before the critical December 31st Brexit deadline. All of this is likely to exacerbate the woes for the sterling.
Meanwhile, in the US, the wide gap in the preliminaries between Biden and Trump has eased off some of the uncertainty of the election. Given that the market has already mostly discounted a likely Biden win, the dollar is probably going to remain unscathed by the race.
At any rate, a Donald Trump victory would represent a "Black Swan" – type event, which would undoubtedly cause a general market surprise. Even still, however, the re-election of Trump should not hurt the greenback. In the wake of the last elections, the currency rallied following the announcement of his win of the White House, and a similar outcome could be expected to take place once again because of his tax plans.
Finally, the deepening coronavirus pandemic is steadily causing a surge in aggregate demand for the greenback across the world, due to its status as a safe-haven currency.
1. Long-Term Outlook:
As can be seen on the daily chart below, the changing fundamental landscape is prompting a resurgence of bearish pressure on the GBPUSD's price action. The pair is in the process of establishing a bearish ABCD pattern. It follows that the next target for the price action would be the lower edge of the descending channel, below the ascending trend line (in blue) and the 38.2 per cent Fibonacci retracement level at 1.26961. Before such a downswing is fully developed, however, a bullish correction could very well emerge first.
The test for such a bullish correction would be represented by the price action breaking out above the 23.6 per cent Fibonacci at 1.30000, which bears a considerable psychological significance, and towards the upper boundary of the descending channel.
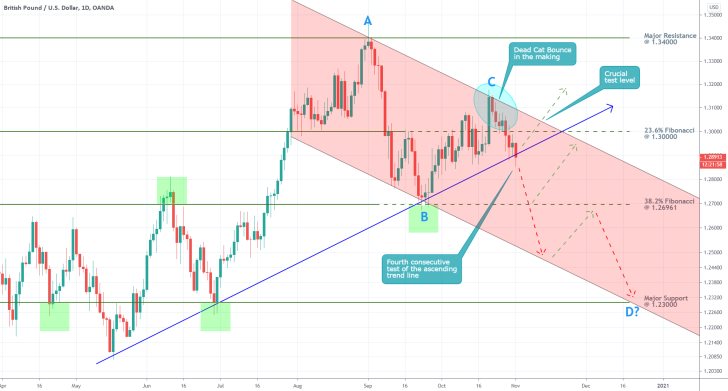
Notice that the price action has already rebounded from the ascending trend line on three separate occasions, which is why the bearish commitment in the market is currently being tested at the spot price level. If the price manages to break down below the trend line decisively, this will support the creation of a 'Dead Cat Bounce' pattern, which, in turn, would confirm the development of broader downtrend.
The first target for such a Markdown is encapsulated by the above-mentioned 38.2 per cent Fibonacci, which is where another consolidation is likely to emerge. Subsequently, the price action could tumble towards the major support level at 1.23000.
2. Short-Term Outlook:
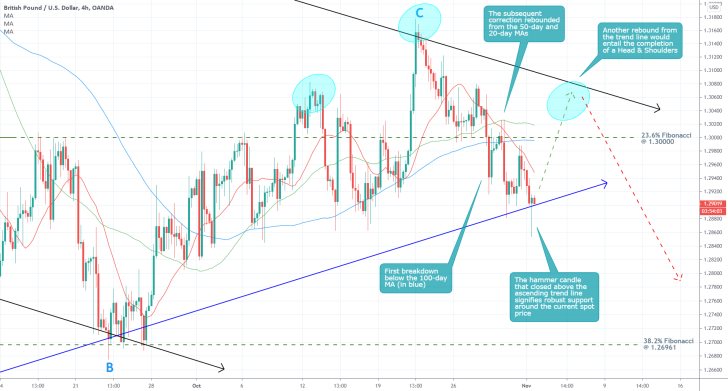
As regards the recent behaviour of the price action, the 4H chart below demonstrates the currently evolving 'Bottleneck' effect between the channel's upper boundary and the ascending trend line. Notice that the price action managed to break down below the 100-day MA (in blue), which represents a major bearish confirmation, but it is also consolidating just above the ascending trend line.
All of this implies the prevalence of bearish pressure overall, but at present, the bulls manage to retain control. As was mentioned earlier, the price action is likely to establish a minor bullish pullback towards the channel's upper limit, before the development of the broader downtrend is resumed. In doing so, the price action would create a classic Head and Shoulder pattern, which typically entails bearish trend reversals. The emergence of such a pattern would entail the perfect conclusion of the BC retracement leg comprising the broader ABCD pattern.
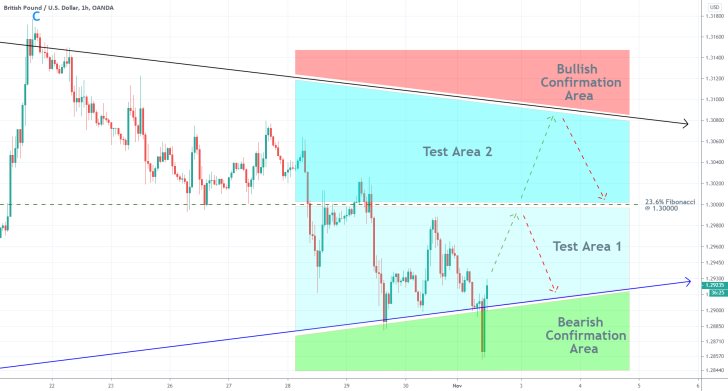
As can be seen on the hourly chart below, the future behaviour of the price action within Test Areas 1 and 2 would determine the subsequent development of the downtrend. These two areas underpin the remaining breadth of the aforementioned 'Bottleneck', so expect heightened fluctuations to occur for as long as the price action remains concentrated within them.
Accordingly, a definitive breakdown below the ascending trend line (within the bearish confirmation area) would signify the resumed development of the downtrend. Conversely, a decisive breakout within the bullish confirmation area would mean a resurgence of bullish pressure, and potential termination of the current trading setup.
3. Concluding Remarks:
The underlying market setup entails the possibility for the implementation of trend-continuation strategies, in that the price action is expected to complete a minor bullish correction before it resumes trading lower.
While both the technical and fundamental factors seem to suggest that the GBPUSD is poised to depreciate in the following days and weeks, traders should remain especially cautious over the span of the next five days. Owing to the aforementioned pivotal events taking place this week, the price action could become quite volatile and erratic.
Hence, the use of trend-continuation trading strategies, which typically entail tight entries around major swing lows and swing highs, could be jeopardised by the overall uncertainty in the market. In other words, the expectations for adverse volatility outbursts could diminish the precision of trend-continuation trades and wipe out any positions with tight stop-losses.
The GBPUSD is Biding its Time to Change Directions
The GBPUSD behaved mostly as anticipated under the projections of the initial analysis, which did a good job of describing the potential impact of the volatility outbursts stemming from the US election results on the price action. However, it couldn`t have expected that the effect of the underlying volatility would be compounded by Pfizer and BioNTech's vaccine news. All of this altered the short-term dynamics in the market, but the longer-term expectations remain mostly the same – namely, that the pair should start depreciating.
Recent data shows that the market is still lagging behind crucial economic developments, which means that the GBPUSD still hasn`t discounted much of the recent performances of the two countries' economies. In the United Kingdom, the GDP growth has stagnated in Q3, and unemployment has reached multiple-years peak. In contrast, the robust performance of the US labour market was continued in October.
All of the underlying fundamentals continue to favour a future strengthening of the greenback against the pound, and the behaviour of the price action is starting to discount those developments slowly.
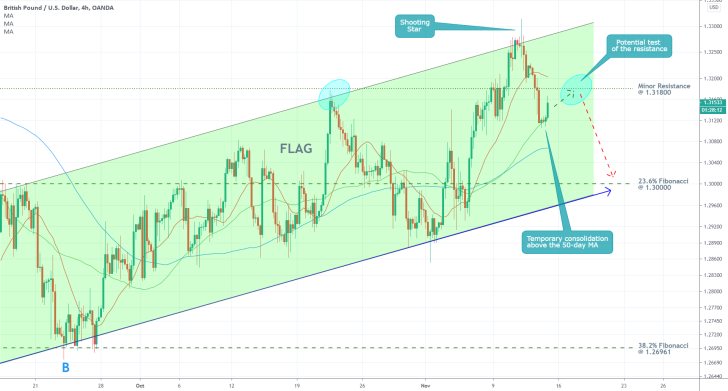
As can be seen on the 4H chart above, the cable remains trading within the boundaries of an ascending channel (a FLAG), which serves the role of a transitionary pattern before the broader bearish trend continues to develop. In other words, the FLAG could be viewed as a likely prelude to a major bearish reversal, provided that the price action manages to establish a decisive breakdown below its lower border.
Such a decisive reversal would entail a break down below the 23.6 per cent Fibonacci retracement level at 1.30000, which bears psychological significance, and the ascending trend line (in blue). So, what exactly points to such a scenario?
In the wake of the US Election results, the cable reached the upper edge of the channel for the third time, before the price action rebounded promptly. What was left was a shooting star candle, which typically entails rising bearish pressure, and could be a precursor to a reversal.
Subsequently, the price action broke down below the 20-day MA (in red), which serves the role of floating support, and is currently consolidating just above the 50-day MA (in green). The price action looks poised to test the strength of the minor resistance level at 1.31800, which was established as a prominent level the second time that the price reached the channel's upper edge.
Therefore, if the price action bounces off from this resistance, the path for the bears would be cleared, and the cable would be able to fall to the 23.6 per cent Fibonacci retracement level next. Once this barrier is also broken, the longer-term bearish sentiment would be reinstated.
The current scenario entails two potential plays for traders. Less risk-averse contrarian traders could look for entry opportunities around the 1.31800 resistance, while more risk-averse traders could look for trend-continuation opportunities after the price action breaks down below the channel.
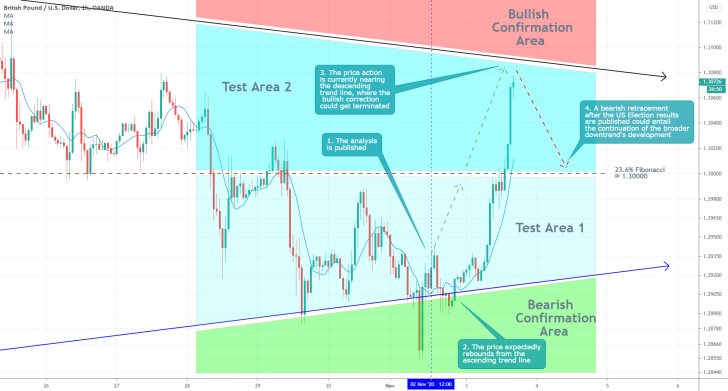
- A bullish correction developed shortly after the publication of the analysis, as per its expectations. The volatility spike was the result of pre-election depreciation of the dollar. The rally could very likely probe the Bullish Confirmation Area, however, once the results of the election are published, the bears are likely to regain control. Thus, the longer-term traders should look for signs of decisive reversal.
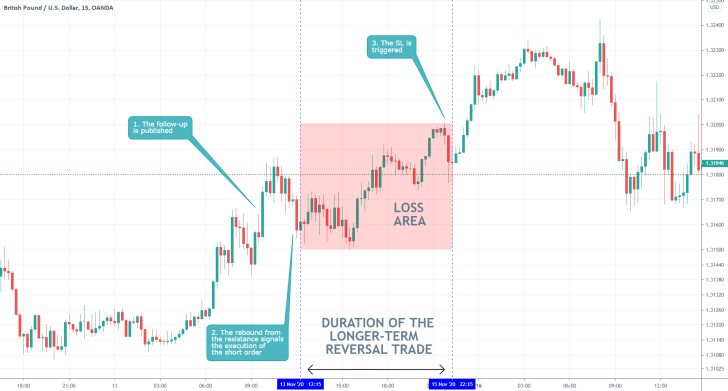
- The last follow-up was not correct in anticipating a reversal around the 1.31800 resistance level. It failed to appreciate the adverse impact that the vaccine news would have on the value of the greenback. The saving grace of the follow-up was its recommendation for more risk-averse traders to wait for confirmation of the reversal. Since there was none, they would not have entered the market prematurely.
- The above setup is an example of why contrarian traders need to use narrow Stop-Loss orders when they trade on the expectation for a reversal around a major resistance/support level.
Disclaimer: Your capital is at risk! Trading and investing on the financial markets carries a significant risk of loss. Each material, shown on this website, is provided for educational purposes only. A perfect, 100% accurate method of analysis does not exist. If you make a decision to trade or invest, based on the information from this website, you will be doing it at your own risk. Under no circumstances is Trendsharks responsible for any capital losses or damages you might suffer, while using the company’s products and services. For more information read our Terms & Conditions and Risk Disclaimer.


