The price action of the GBPUSD has been establishing a major bullish pullback over the last couple of weeks on the unusual dollar weakness that was observed over the same period. It was triggered by a mixture of various contributing factors, including stagnating pace of global recovery and a resurgence of demand for higher-yield assets. This trend can now be challenged by shifting market sentiments.
The biggest technology companies in the U.S. are scheduled to post their quarterly earnings this week, and the consensus forecasts expect robust growth numbers. A recuperating stock market would be good news for greenback bulls, as demand for tech stocks abroad increases. Foreign investors would need dollars in order to purchase U.S. stocks, which is why the currency is likely to strengthen over the near future.
The underlying setup thus seems suitable for the implementation of contrarian trading strategies by bears looking to sell the peak of the latest bullish pullback in anticipation of a subsequent dropdown.
Consolidation Between Two Moving Averages
As can be seen on the daily chart below, the price action appears to be developing a broad 1-5 impulse wave pattern, as postulated by the Elliott Wave Theory. The latest pullback from 1.34200 thus seems to be serving the role of the second retracement leg (3-4) of the structure.
Selling the latest swing peak would thus entail trading on the expectations for the development of the last impulse leg (4-5), which is likely to penetrate below the previous swing low (at 1.34200). The question is, therefore, whether the (3-4) retracement leg has indeed been completed, or would it be extended a little bit further north before a decisive reversal occurs.
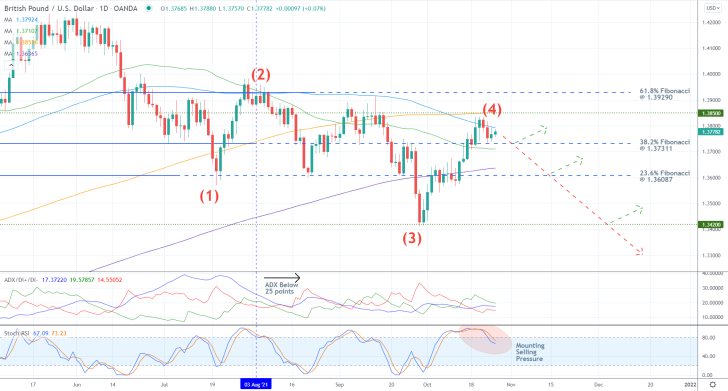
The price action is currently consolidating above the 38.2 per cent Fibonacci retracement level at 1.37311, which is converging with the 50-day MA (in green). This represents a very strong support level that could help the upswing be extended higher towards the previous swing peak at 1.38500.
On the other hand, the price action has been failing to break out above the 100-day MA (in blue) decisively over the last five days, which could be interpreted as an early indication of a likely reversal in the very near future.
This assertion is further substantiated by the fact that the ADX indicator has been threading below the 25-point benchmark since the 3rd of August, signalling that the market has been range-trading over the same period. Under these conditions, the price action is more likely to turn from major levels of support and resistance. The Stochastic RSI indicator already underpins mounting selling pressure, which is congruent with the expectations for a reversal soon.
At any rate, if the retracement leg is not completed at the 100-day MA, the reversal would quite probably occur from the 1.38500 resistance level. The latter's role as a major make-it-or-break-it threshold is further substantiated by the fact that it is currently converging with the 200-day MA (in orange).
Bears can look for a chance to sell the underlying at either of the two. The first target level for the renewed downtrend would be the 23.6 per cent Fibonacci at 1.36087, which was recently crossed by the 300-day MA (in purple). The next target would be the aforementioned swing low at 1.34200.
Waiting for a Break in the Ascending Channel
The (3-4) retracement leg is represented as an ascending channel on the 4H chart below. Once the price action breaks down below its lower limit decisively, this would signal the beginning of the (4-5) impulse leg. Further confirmation would be underpinned by a breakdown below the 38.2 per cent Fibonacci.
Notice that the price action has been threading above the 50-day MA (in green) over the last several days, which has been rising parallel to the lower limit of the channel. This underscores persisting buying pressure just below the two.
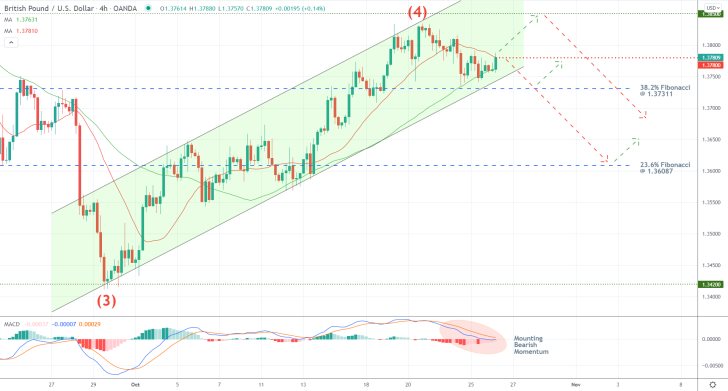
On the other hand, the price action is also concentrated below the 20-day MA (in red), which currently represents the major resistance at 1.37800. This is an early signal of mounting bearish pressure. The same is also illustrated by the MACD indicator. That is why bears should continue monitoring the behaviour of the price action around the two before they decide where to sell exactly.
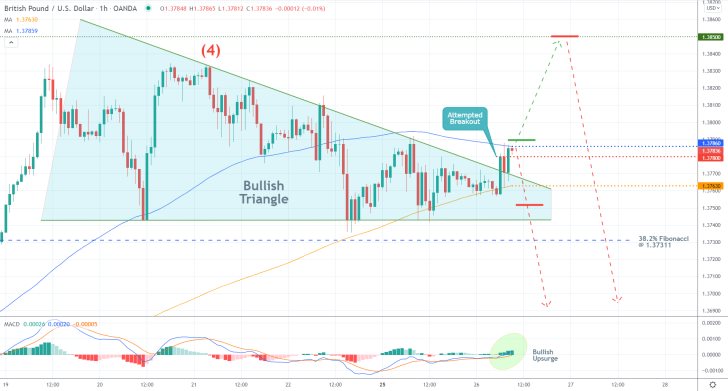
The most significant reason as to why bears should not place premature selling orders can be seen on the hourly chart below. The emergence of a Bullish Triangle, which is typically taken to signify a likely trend continuation, at the peak of the retracement leg underpins the possibility of it being extended towards the swing peak at 1.38500.
The current attempt at a breakout above the Triangle is complemented by a recent uptick in bullish momentum, as indicated by the MACD. The breakout emerged after the price action was able to rebound from the 200-day MA (in orange), which signifies the importance of the 1.37630 support level.
Nevertheless, the price action remains concentrated below the 100-day MA (in blue), which notably now serves as a floating resistance. That is why the behaviour of the price action around 1.37860 would represent the most significant indication of whether the reversal would occur there or around 1.38500.
Concluding Remarks
If the price action manages to close above 1.37860 in the next several hours, bulls would be able to place buying orders, provided that they implement very narrow stop-losses. They should not be placed more than 20 pips below the initial entries. Bulls should collect their profits at 1.38500.
Meanwhile, bears can consider entering short on the condition that the price action breaks down below 1.37630 or once it climbs to 1.38500. Their supporting stop-losses should not exceed 40 pips.
GBPUSD with a New 1-5 Elliott Pattern
The long-awaited bearish reversal on the price of the GBPUSD finally took place. Meanwhile, the newly developing downtrend appears to be taking the form of a 1-5 impulse wave pattern, as postulated by the Elliott Wave Theory. This offers bears the chance to implement trend continuation trading strategies.
Despite the prevailingly bearish sentiment, there are some reasons to expect a minor bullish pullback, which would represent bears with an opportunity to sell at the next peak. The anticipated temporary strengthening of the pound is subject to the hawkish forecasts for the upcoming meeting of the Monetary Policy Committee (MPC) of the BOE.
Meanwhile, the Federal Open Market Committee (FOMC) of the Federal Reserve is also scheduled to meet this week. Volatility on the U.S. dollar is also likely to be bolstered by the COP26 conference in Glasgow. Thus, bears should consider entering short only after there are definite signs that the current pullback is completed.
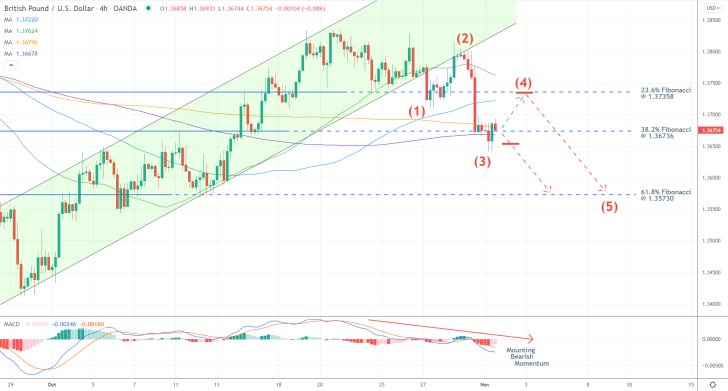
As can be seen on the 4H chart above, the price action recently broke down below the ascending channel's lower boundary, which indicated the trend reversal. The breakdown to the 23.6 per cent Fibonacci retracement level at 1.37358 was followed by a throwback to the channel from below. This represented the first retracement leg (1-2) of the Elliott pattern.
Subsequently, the price action established the second impulse leg (2-3), which consolidated above the 38.2 per cent Fibonacci at 1.36736. It is also important to point out that the 200-day MA (in orange) and the 150-day MA (in purple) are both converging around the latter, making it a stronger turning point.
That is why the second retracement leg (3-4) is likely to emerge from the current spot level. It is likely to pull back to the 23.6 per cent Fibonacci from below. The latter, in turn, is about to converge with the 50-day MA (in green) and the 100-day MA (in blue), making it an even more powerful resistance level.
Bears can either place short market orders around 1.36500, provided that the price action manages to break down below the 38.2 per cent Fibonacci decisively, or short limit orders around the 23.6 per cent Fibonacci. In either case, their supporting stop-loss orders should not be placed more than 30 pips away from their initial entries.
The next target for the downtrend is underpinned by the 61.8 per cent Fibonacci at 1.35730.
GBPUSD Close to Completing a Major Wyckoff Cycle
The price action of the GBPUSD is close to completing a major Wyckoff cycle, as postulated by the Wyckoff Method Theory. This is demonstrative of the fractal nature of the price action, which could be taken advantage of by traders.
There are several reasons to expect a minor bullish pullback before the broader downtrend can continue heading lower, primarily because of the top-tier events in the economic calendar for this week.
According to the preliminary market forecasts, the pace of economic expansion in Britain is expected to slow down in the third quarter, which would likely contribute to the longer-term depreciation of the pound. However, things are slightly more different in the shorter term.
The dollar was jolted towards the end of last week following the November policy decision of the Federal Reserve and the publication of the October non-farm payrolls. This trend can continue until Wednesday of this week, as the Bureau of Labour Statistics (BLS) publishes the latest PPI and CPI inflation numbers.
Therefore, the current setup seems suitable for the implementation of trend continuation trading strategies. In particular, bears can wait for the price action to complete the latest pullback before they enter short at the peak of the correction. They will be doing so with the intention of catching the continuation of the development of the broader downtrend.
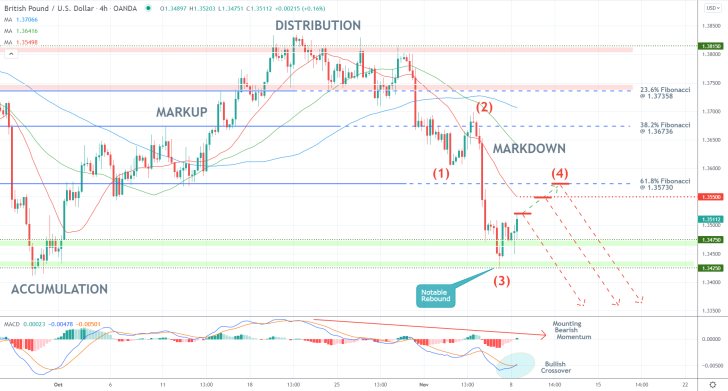
As can be seen on the 4H chart above, the price action is currently developing a new massive Markdown under the Wyckoff model. It takes the form of a 1-5 Elliott impulse wave pattern. Given that the second impulse leg (2-3) rebounded from the lower limit of the last Accumulation range, the price action is likely to establish the second retracement leg (3-4) next. It will serve as the pullback, as mentioned earlier.
The steep decline of the two EMAs comprising the MACD indicator underpins the strong bearish momentum at present. However, the recent bullish crossover, coupled with the rising histogram, implies the probable emergence of a bullish pullback next.
Bears can look for an opportunity to enter short provided the price action reverses from one of these three price levels by more than 20 pips. These include the current market price (1.352250), the major resistance level at 1.35500 underpinned by the 20-day MA (in red), or the 61.8 per cent Fibonacci retracement level at 1.35730.
In either case, their supporting stop-loss orders should not exceed more than 30 pips above their initial entry levels. Once the price action comes close to the lower limit of the Accumulation range (at 1.34250), bears could then substitute their fixed stop orders for floating TPs. That way, they would be able to squeeze the maximum out of a potential dropdown into uncharted territory.
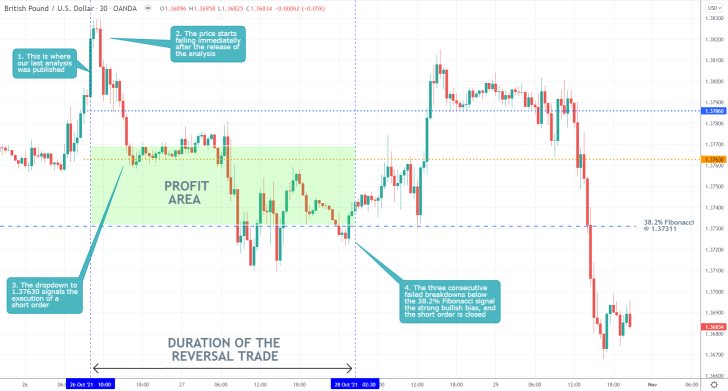
- Our latest analysis of GBPUSD successfully forecasted the beginning of a new downtrend, though the transition was not smooth.
- Notice that once the price action reached the 38.2 per cent Fibonacci retracement level at 1.37311, it failed to break it decisively on three separate occasions.
- Knowing that trend reversals are typically characterised by heightened volatility, it might be prudent to collect your running profits around such major thresholds in order to protect yourself against sudden changes in the direction of the price action.
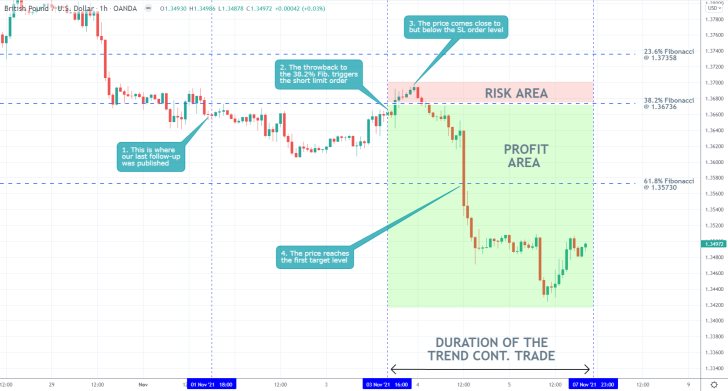
- Our last GBPUSD proved a massive success. The continuation of the existing downtrend exceeded the expectations of the analysis as the price action broke down below the 61.8 per cent Fibonacci retracement level at 1.357730.
- The analysis also quite actually forecasted a reversal from the 38.2 per cent Fibonacci at 1.36736.
- The trade garnered more than 200 pips.
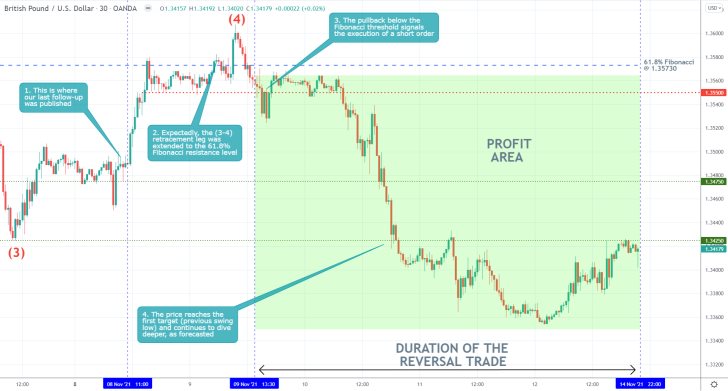
- Our last analysis of GBPUSD proved to be a massive success. Its forecasts were almost fully met. The (3-4) retracement leg expectedly continued to appreciate following the release of the analysis.
- It reversed from the 61.8 per cent Fibonacci retracement level at 1.35730, triggering the execution of a selling order. Subsequently, the price action reached the first target level (the previous swing low at 1.34250) before continuing to dive deeper.
- The recent throwback to 1.34250 likely signifies a temporary break in the development of the new downtrend before the price action can continue heading further down south.
Disclaimer: Your capital is at risk! Trading and investing on the financial markets carries a significant risk of loss. Each material, shown on this website, is provided for educational purposes only. A perfect, 100% accurate method of analysis does not exist. If you make a decision to trade or invest, based on the information from this website, you will be doing it at your own risk. Under no circumstances is Trendsharks responsible for any capital losses or damages you might suffer, while using the company’s products and services. For more information read our Terms & Conditions and Risk Disclaimer.


