Over the last couple of weeks, the GBPJPY pair has been establishing a major bullish pullback, primarily driven by heightened investors' optimism in Britain. The latter was triggered by the easing of government restrictions in the UK despite persisting delta variant complications. Presently, the impact of this optimism seems to be waning.
The positive growth numbers in Japan from last week have managed to help the struggling yen recuperate in the short term, which is now likely to lead to another bearish reversal on GBPJPY. This trend is also likely to be bolstered by the expectations for robust growth in the broader Asia region.
In contrast, the sterling is likely to be affected negatively by the strengthening U.S. dollar, which would increase the likelihood of another GBPJPY bearish reversal. Hence, the current setup seems suitable for the implementation of contrarian trading strategies on the price of GBPJPY by bears.
Probing the Major Descending Trend Line
As can be seen on the daily chart below, the price action is currently testing the major descending trend line (in red) for the fourth time. The price has always reversed itself from this prominent threshold on the three separate occasions it probed it before, which is why a fourth reversal at the present rate seems highly probable.
Notice that the candlesticks from the last several days have distinctly small bodies and larger tails. This implies growing uncertainty in the market, the type of environment that is typically seen before the market changes directions.
This assertion is further substantiated by the fact that the ADX indicator has been threading below the 25-point mark since the 26th of August. Such a reading indicates that the market is currently range-trading, which is a common occurrence at times when the market transitions from an existing uptrend into a new downtrend.
The Stochastic RSI indicator, in turn, has been threading in its overbought extreme for the last several days. Given the underlying range-trading environment, this is likely to indicate a very probable increase in selling pressure in the near future.
What both bulls and bears should keep in mind is that the price action has been consolidating below the descending trend line but above the 50-day MA (in green) over the last several days. This creates a bottleneck, which is likely to catalyse a major swing once the price action breaks out above it.
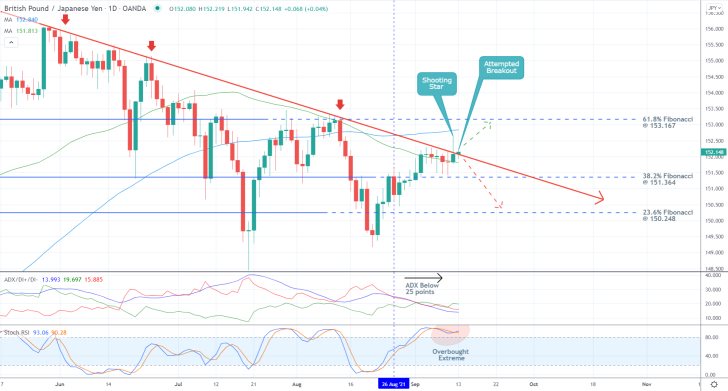
On the one hand, the emergence of a Shooting Star candle last Friday corroborates the primary expectations for a subsequent reversal. It is likely to be followed by an initial probing of the 38.2 per cent Fibonacci retracement level at 151.364, which roughly outlines the bottom of the narrow consolidation range that has taken shape over the last several days.
The 23.6 per cent Fibonacci retracement level at 150.248 represents a deeper target for the renewed downtrend.
On the other hand, should the price action manage to break out above the descending trend line and subsequently strengthen above it, this could serve as an additional boost to the underlying uptrend. This could result in the continuation of the uptrend towards the 61.8 per cent Fibonacci at 153.167.
Observing the Diminishing Market Volatility
The underlying levels of market volatility have been dropping ever since the beginning of the recent consolidation range, as shown on the 4H chart below. This is confirmed by the horizontal Bollinger Bands, which imply the waning power of the upswing.
Notice that following yesterday's failed breakout (above the trend line), the price action is currently concentrating below the previous swing peak at 152.200. It's also strengthening above the middle band (the 20-day MA) of the BBs (in orange). This behaviour characterises the aforementioned bottleneck in greater detail.
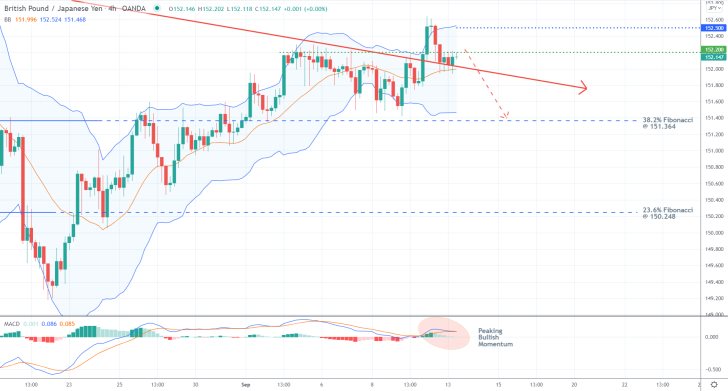
Meanwhile, the MACD indicator is illustrating peaking bullish momentum, which could be a likely precursor to an imminent bearish reversal. Hence, a potential dropdown below the descending trend line and the 20-day MA could very likely signal the beginning of this new downtrend.
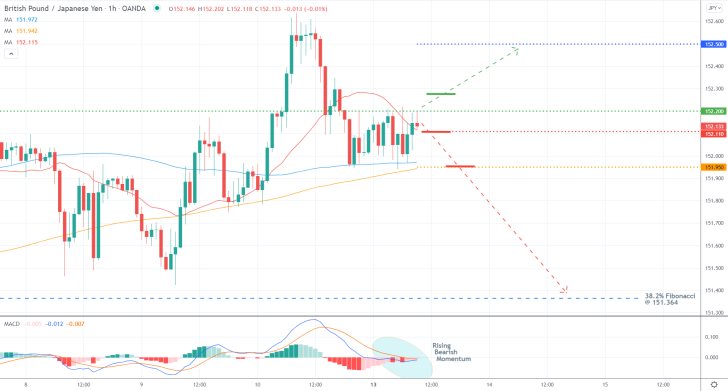
This increase in bearish momentum is better represented on the hourly chart below. The MACD indicator has already crossed below the 0.00 benchmark, while the histogram is turning more negative.
Traders should carefully monitor the price action's behaviour around the edges of the consolidation range, as this would likely indicate its future direction.
The 152.200 resistance, which was recently crossed by the 20-day MA (in red), represents the upper limit of the range. Meanwhile, the convergence of the 100-day MA (in blue) with the 200-day MA (in orange) around 151.950 underpins the lower limit of the range.
Concluding Remarks
As regards the current trading opportunities for bulls, they should only consider entering the market if the price action manages to break out above the former and close above it. The first target for bulls is underscored by the 152.500 resistance. Upon entry, bulls should place their stop-loss orders around the current price level of the 20-day MA (152.110).
Bears, in contrast, can consider entering short around the current spot price. They should place their stop-loss orders no more than 40 pips away from their initial entry. If the price action manages to break down below the 200-day MA at 151.950, bears can potentially consider adding to their existing selling orders.
They can also move their stop-losses either to breakeven or substitute them for floating TPs. As mentioned earlier, the first major target for the new downtrend is encompassed by the 38.2 per cent Fibonacci retracement level at 151.364.
GBPJPY's Downtrend is Gaining Momentum, Waiting for a Throwback
As was forecasted by our previous analysis of the pair, the GBPJPY started developing a new major downtrend. This is the result of the ongoing strengthening of the U.S. dollar, which is the most significant market determinant at present, coupled with a depreciation of the pound.
There is a very high probability that the price action would continue to head lower in the near future; however, the next bullish pullback could offer bears the opportunity to join the market at the most opportune moment - at the next peak.
Such a temporary break in the development of the trend could take place over the next several days, prompted by the upcoming monetary policy decisions of the BOE and BOJ. This is owing to the expectations for the adoption of a slightly more hawkish stance by the BOE, which, in turn, could momentarily stave off the freefall of the sterling.
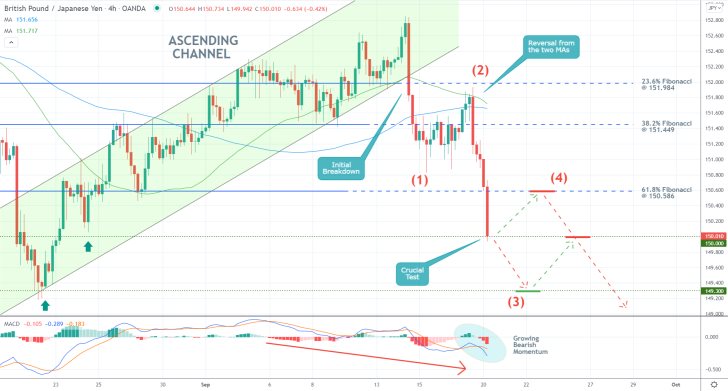
As shown on the 4H chart above, the new downtrend started developing following the decisive breakdown below the lower boundary of the Ascending Channel. Then, the price action subsequently penetrated below the 23.6 per cent Fibonacci retracement level at 151.984 and the 38.2 per cent Fibonacci at 151.449.
A throwback to the crossover between the 50-day MA (in green) and the 100-day MA (in blue) ensued before another decisive reversal took place. Afterwards, the price action broke down below the 61.8 per cent Fibonacci at 150.586 as well and is currently testing the last swing low at 150.000. The latter bears psychological importance.
The MACD indicator underpins the increasingly more pronounced bearish momentum. Meanwhile, the latest downswing appears to be taking the form of a descending 1-5 impulse wave pattern, as postulated by the Elliott Wave Theory. Presently, the price action is in the process of developing the second impulse leg (2-3).
Once it bottoms out, presumably either around the current support at 150.00 or the 149.300 level, the second retracement leg (3-4) would likely follow. This would likely result in a pullback to the 61.8 per cent Fibonacci from below before the broader downtrend can be resumed.
Once they see definite signs of price consolidation around either of the two supports, bulls can try to implement contrarian trading strategies in a bid to catch the second retracement leg. Their stop-loss orders should not be placed more than 30 pips away from their initial entries.
Bears, in contrast, can look for an opportunity to sell around the 61.8 per cent Fibonacci after the next pullback is completed.
GBPJPY's Pullback is Now Completed, the Price Ready to Reverse
The price action of the GBPJPY established a sharp bullish rebound recently following the release of the latest U.S. inflation numbers. This pullback now looks completed, and the price action would likely continue tanking as part of the development of a new broader downtrend.
Today's reversal was prompted after China's central bank - the People's Bank of China (PBOC) - announced new stringent laws making all cryptocurrency activities illegal. This had the immediate effect of increasing the levels of adverse volatility on all high-risk assets, which consequently bolstered the demand for the U.S. dollar.
The sterling, which falls within the former category, suffered in the wake of this mounting uncertainty, which is why the new GBPJPY downtrend is likely to continue developing in the near future. Meanwhile, the yen is strengthening following the September meeting of the Bank of Japan.
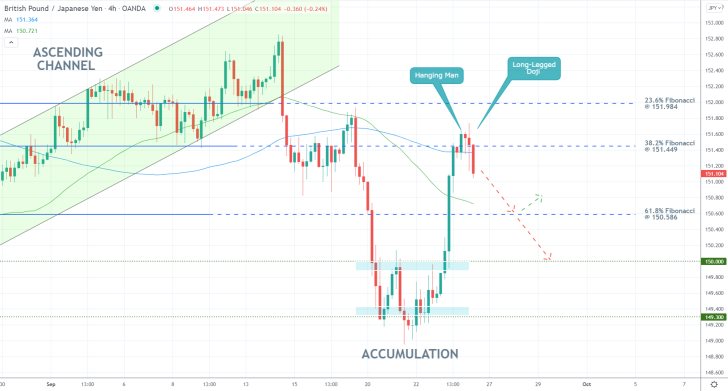
As can be seen on the 4H chart above, the aforementioned pullback emerged as a breakout above the Accumulation range. It reached the 38.2 per cent Fibonacci retracement level at 151.449, where it was exhausted.
Notice that the reversal was confirmed by the emergence of two distinct types of candlesticks. First, a Hanging Man candle, which typically signifies rising bearish sentiment, peaked just above the Fibonacci resistance. Then, a Long-Legged Doji confirmed the changing buying and selling pressures.
The newest candle (bearish engulfing), which broke down below the 100-day MA (in blue), represents the readiness of the price action to continue sliding right away.
Bears looking to sell around the current spot price should place their stop-loss orders just above the 38.2 per cent Fibonacci, no more than 20 pips above it. Their first target is underpinned by the 61.8 per cent Fibonacci 150.586.
If the price action manages to penetrate below it decisively, its next target would likely be the upper limit of the Accumulation range at 150.000. The latter is a psychologically significant resistance-turned-support level, making it a likely turning point.
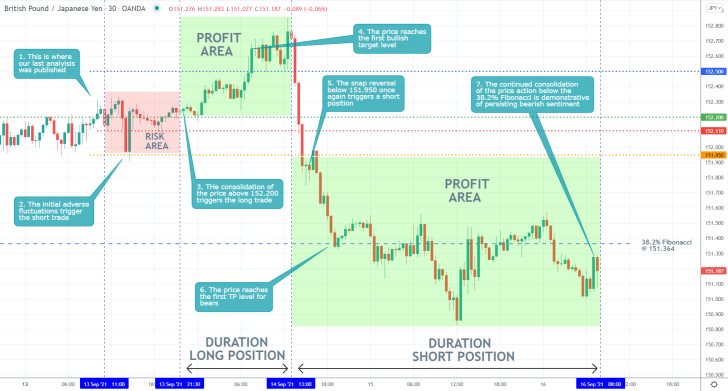
- Our last analysis of the GBPJPY yielded profits for both bulls and bears. Despite the initial adverse fluctuations, which generated a small loss, the price action did go on to climb to the 152.500 resistance, as expected. This yielded 24 pips in profits for the bulls.
- The subsequent reversal below 151.900, in turn, triggered the short trade, which generated an additional 60 pips in profits.
- The continued consolidation of the price action below the 38.2 per cent Fibonacci retracement level at 151.364 is likely suggestive that the currently emerging downtrend would continue heading lower in the near future.
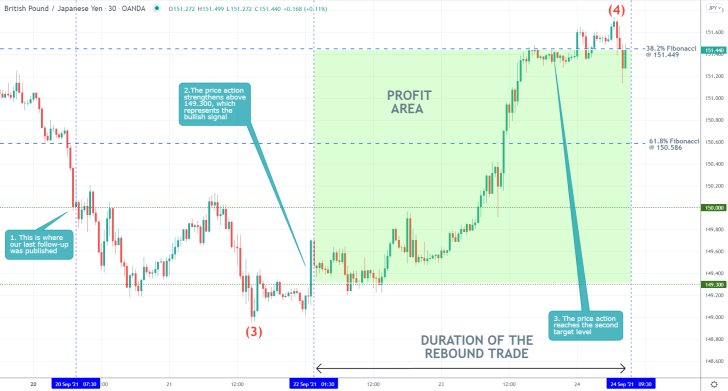
- Our last GBPJPY follow-up successfully forecasted a bullish rebound from the major support level at 149.300 to the 38.2 per cent Fibonacci retracement level at 151.449. The trade caught more than 200 pips from the new upswing.
- Presently, the price action appears to be consolidating around the Fibonacci retracement. The behaviour of the price action around this major threshold would point to the next target for the pair.
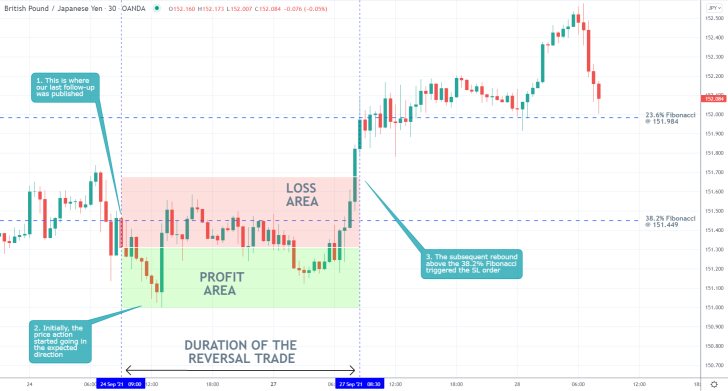
- Despite some initial gains, our last follow-up analysis of the GBPJPY incurred a small loss. This happened after the price action managed to penetrate above the 38.2 per cent Fibonacci retracement level at 151.449 and hit the stop-loss order that was placed 20 pips above it.
- Even so, the trade was an overall success given that the narrowly placed SL served its purpose in preventing bigger losses.
Disclaimer: Your capital is at risk! Trading and investing on the financial markets carries a significant risk of loss. Each material, shown on this website, is provided for educational purposes only. A perfect, 100% accurate method of analysis does not exist. If you make a decision to trade or invest, based on the information from this website, you will be doing it at your own risk. Under no circumstances is Trendsharks responsible for any capital losses or damages you might suffer, while using the company’s products and services. For more information read our Terms & Conditions and Risk Disclaimer.


