The price action of the GBPBJPY is currently probing a major support level that has been prevalent over the last few months. It serves as the lower limit of a broad Distribution range, as postulated by the Wyckoff Cycle theory. Hence, if the price action manages to penetrate below it decisively, this would likely mark the beginning of a new downtrend that is likely to develop over the next several months.
The likely catalyst for such a breakdown could be the recent petrol crisis that embroiled Britain over the last few days. Even though Boris Johnson and his cabinet urge people to stop panic-buying gas as the situation is normalising, the heightened energy demand and looming uncertainty are pressuring the sterling.
Meanwhile, the recent monetary policy decision of the Bank of Japan to keep the scale of its quantitative easing programs unchanged is good news for the yen. These two developments create a considerable discrepancy between the demand for the pound and the yen.
Also, the recently observed pick up in U.S. factory output signals that the global recovery uncertainty is diminishing, which is good news for the greenback and consequently bad news for the pound. This trend could be bolstered tomorrow by the latest manufacturing numbers in China.
Overall, the underlying fundamentals seem to be congruent with the assessment that the GBPJPY pair is due for another downtrend. Bears can use this to their advantage by utilising contrarian trading strategies.
Reversal from the Descending Trend Line
As can be seen on the daily chart below, the most significant indication of the rapidly rising selling pressure is the recent reversal from the descending trend line (in black). At the height of the pullback, the price action had reached the 100-day MA (in blue) before it promptly changed directions.
The subsequent dropdown resulted in a decisive breakdown below the 38.2 per cent Fibonacci retracement level at 151.346 and the 50-day MA (in green). Presently, the price action is probing the next crucial threshold - the 23.6 per cent Fibonacci at 150.233. Its close proximity to the psychologically significant support at 150.000 makes it a critical barrier. Moreover, the 200-day MA (in orange), which serves as a floating support, is about to converge with the 23.6 per cent Fibonacci.
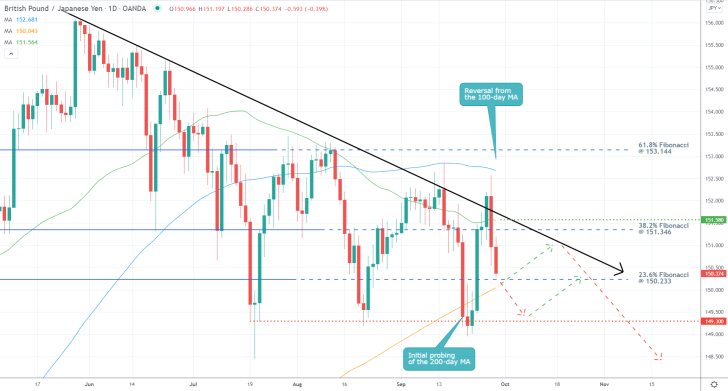
That is why one final pullback to the descending trend line could emerge from the current spot level before the downtrend can resume heading lower. This already happened once following the initial testing of the 200-day MA. Hence, more risk-averse bears may try to wait for such a pullback to be terminated before they enter short at its resulting peak. Conversely, they might opt to sell after the price action breaks the 23.6 per cent Fibonacci.
In either case, the first target for the new downtrend would be encapsulated by the major support level at 149.300. The latter has already been tested on three separate occasions, managing to hold back the bearish pressure each time.
How Likely is it for a Pullback to Emerge Now?
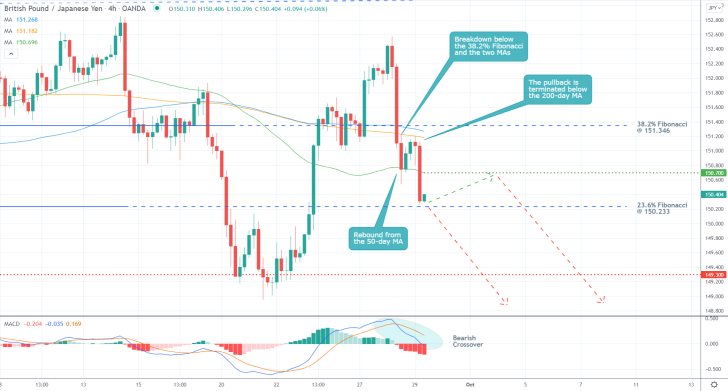
The underlying momentum is ostensibly bearish, given the recent crossover that was registered by the MACD on the 4H chart below. The histogram of the indicator underpins growing bearish momentum, which is congruent with the primary expectations. Even so, this does not preclude the possibility of the emergence of a minor pullback in the near future.
Notice that following the breakdown below the 38.2 per cent Fibonacci, the price action rebounded from the 50-day MA (in green). This was followed by a pullback to the 200-day MA, confirming its new role as a floating resistance. The rebound also underpinned the significance of the minor support-turned-resistance at 150.700.
Similar behaviour can be anticipated now, with the price action possibly testing the 50-day MA's new role as a floating resistance. Hence, bears can look for an opportunity to enter short around the 150.700 resistance.
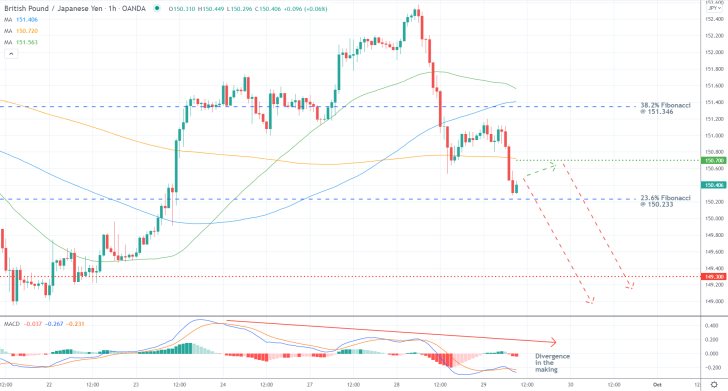
Interestingly enough, the significance of the support-turned-resistance at 150.700 is also evident on the hourly chart below. This time, the threshold is aligned with the 200-day MA instead of the 50-day MA. This congruency makes it even likelier for a pullback to occur.
At the same time, the MACD indicator is demonstrating a divergence in the making - one additional confirmation of the selling opportunity. The divergence is exemplified by the fact that while the price action was making the last two bullish waves, the waves of the indicator were decreasing.
Concluding Remarks
As stated earlier, more risk-averse bears can look for an opportunity to sell the GBPJPY around 150.700, whereas less risk-averse bears can do so after the price action manages to close below the 23.6 per cent Fibonacci retracement level at 150.233. In either case, their stop-loss orders should not be placed more than 40 pips away from their initial entries.
The first target level for the renewed downtrend is encapsulated by the major support at 149.300. Once the price action reaches it, bears can substitute their fixed stop orders for floating TPs. That way, they can squeeze the maximum out of a dropdown into uncharted territory.
GBPJPY Close to Completing a Three-Top Pattern
GBPJPY's price action is drawing near the previous swing peak for the third time in a row. This results in the potential establishment of a major three-top structure, which is a type of pattern that typically is taken to signify likely bearish reversals. Hence, the underlying setup seems suitable for the implementation of contrarian trading strategies.
The sterling was able to recuperate from the recent upsurge in selling pressure following the publication of the massively disappointing construction data for September. The currency is projecting strength despite all of the recent tribulations faced by the British economy; however, this should not be perceived as a direct confirmation of a new bullish trend for the pound currently in the making.
The market is anticipating the release of the latest U.S. employment numbers, which is more than likely to indirectly impact the GBPJPY pair as well. If the consensus forecasts are met, and it is shown that the U.S. labour market has bounced back up in September, this is likely to jolt the GBPUSD pair. In all likelihood, the fallout from a potentially robust non-farm payrolls report for the previous month is going to affect the GBPJPY adversely.
Today's jobs report in the U.S. could therefore catalyse an expected reversal on the GBPJPY from a major resistance level, thereby completing the three-top structure. This analysis examines the underlying opportunity for the implementation of contrarian trading strategies by bears looking to join the market on these expectations.
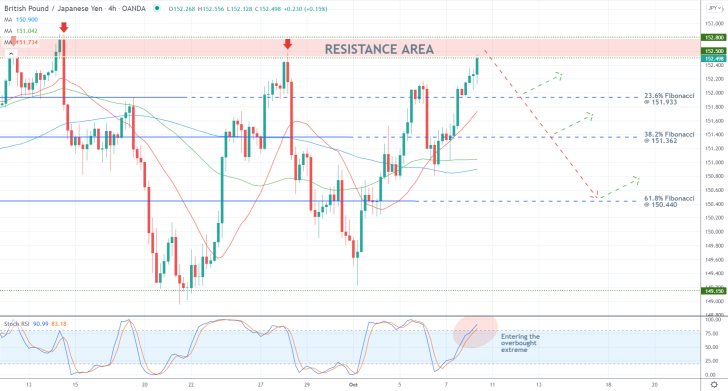
As can be seen on the 4H chart above, the price action remains concentrated within the borders of a massive consolidation range. Its lower boundary is underpinned by the major support level at 149.150, while the major resistance at 152.500 serves as its upper limit.
Given the aforementioned fundamentals and the fact that the Stochastic RSI indicator is entering into the overbought extreme, a sharp rebound from the upper end of the range can be expected to occur soon. Even though adverse fluctuations to the 152.800 resistance (marking the upper edge of the Resistance Area) could take place beforehand.
That is why reactive bears - executing selling orders after the release of the September NFP report - should consider placing tight stop-loss orders no more than 20 pips above the 152.800 resistance (or 40 pips from their initial entry).
The first target for such a new downturn is underscored by the 23.6 per cent Fibonacci retracement level at 151.933, which is about to be crossed by the 20-day MA (in red). This is what makes it the first potential obstacle for the new downturn. The second target, naturally, is the 38.2 per cent Fibonacci at 151.362. It would soon converge with the 50-day MA (in green) and the 100-day MA (in blue).
If the price action manages to penetrate below the final Fibonacci threshold (the 61.8 per cent at 150.440), it would then be free to potentially fall to the lower limit of the broader consolidation range (at 149.150).
GBPJPY's Vertical Rally Against History
The GBPJPY has generated an impressive, almost vertical rally over the past week, prompted by recent events. Despite the significant bullish commitment in the market, as underpinned by the MACD indicator on the daily chart below, there are a couple of factors that both bulls and bears should pay attention to.
Unsurprisingly, the currently unfolding global energy crisis represents the most substantial catalyst of GBPJPY's rally. With all of the extra uncertainty that presently plagues the market, the U.S. dollar, which is generally considered to be a low-risk asset, became the biggest loser. In turn, the greenback's struggles, exacerbated by the latest inflation numbers, had an overwhelmingly positive impact on the pound.
The underlying rally of the GBPJPY is riding on massive amounts of volatility (as indicated by the widening Bollinger Bands), which opens up the possibility for the implementation of specific volatility-based trading strategies. The price action has been rising consecutively over the last seven days. Under these conditions, the 7+1 reversal strategy can be utilised.
Essentially, the strategy entails selling near the closing price (as long as it is above that day's opening price) on the seventh day. Bears should place supporting stop-losses just above that peak while waiting for a sizable correction. Even if the price action goes on to continue appreciating for the eighth or even ninth consecutive day, the very narrow stop-losses will offer them an excellent risk-to-reward ratio.
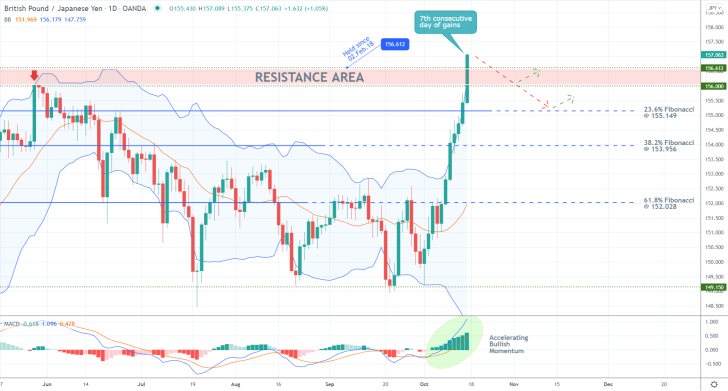
As can be seen on the daily chart above, today's price action does represent the seventh day of consecutive gains. What is even more interesting is that it is testing, and for the time being breaking, the 156.612 resistance level. This major resistance has held back the price action since the second of February 2018, making it a turning point with historical significance.
In other words, the prominence of the 156.612 resistance level coupled with the expectations of the 7+1 days strategy makes a very compelling case for selling the GBPJPY near today's closing price. Since today is Friday, traders better consider joining the market during the Asian open on Monday in order to avoid any unforeseeable developments over the weekend, provided that the price action does not open with a massive gap.
Bears who decide to sell at today's close/Monday's open should place their stop-losses no more than 20 pips away from the closing/opening price. This applies to each consecutive trading day that they decide to implement the 7+1 strategy. The correction could reach either the lower limit of the Resistance Area - the previous swing peak at 156.000 - or the 23.6 per cent Fibonacci at 155.149.
Bulls, in contrast, can wait for the correction to bottom out before they implement trend continuation trading strategies at the resulting dip.
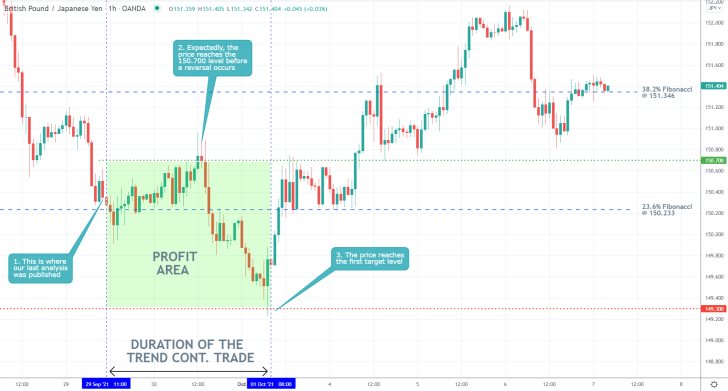
- Shortly after the publication of our last GBPJPY analysis, the price action expectedly consolidated between the 23.6 per cent Fibonacci retracement level at 150.233 and the major resistance at 150.700. The initial false breakdown below the former may have prompted some bears to place their selling orders then, only to have their stop-losses triggered on the subsequent pullback.
- Despite incurring an initial loss of 40 pips, the price action did reverse from 150.700, and bears would have been able to catch the renewed downtrend to 149.300. This would have compensated for the initial loss and resulted in net profit.
- That is why traders need to be confident and calm, even when their initial entries do not pan out the way they hope. If you have the mental stamina to endure such adverse market fluctuations and are confident in your forecasts, you would achieve consistency in your trading.
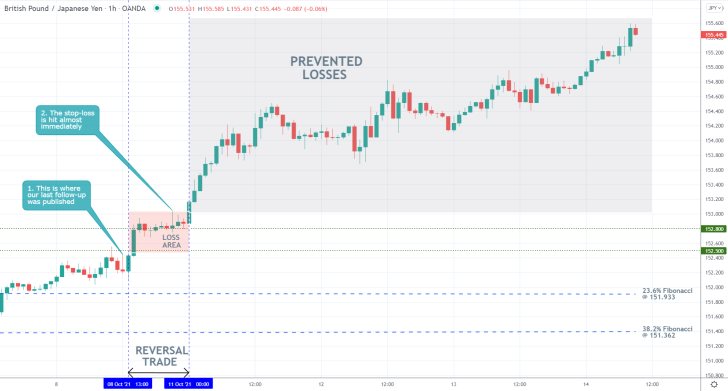
- The forecasts of our previous follow-up analysis of GBPJPY were completely off. The price action did not reverse from the Resistance Area spanning between 152.500 and 152.800. Instead, the existing rally was extended further north.
- The only redeemable quality of the analysis was the narrow stop-loss that was placed just above the Resistance Area, which prevented much bigger losses.
- The fundamental reason for the failure of the analysis was its misunderstanding of the impact of the still brewing global energy crisis.
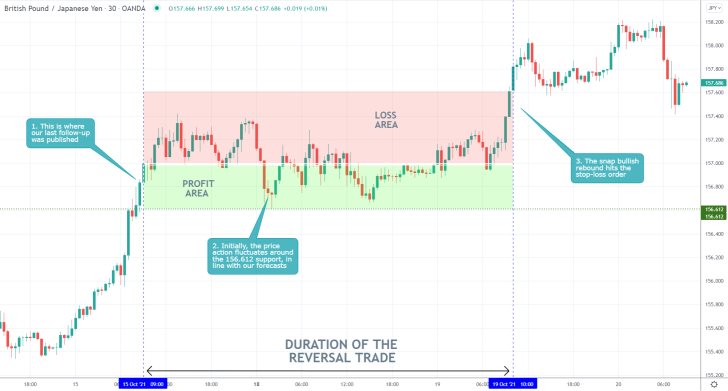
- Despite some initial moderate success, the forecasts of our last GBPJPY follow-up analysis ultimately were not realised. Shortly after its publication, the price action consolidated just above the historically significant resistance-turned-support level at 156.612.
- However, the subsequent bullish rebound triggered the stop-loss order.
- That is why it is prudent to implement very narrow SLs whenever trading on the expectations for a trend reversal.
Disclaimer: Your capital is at risk! Trading and investing on the financial markets carries a significant risk of loss. Each material, shown on this website, is provided for educational purposes only. A perfect, 100% accurate method of analysis does not exist. If you make a decision to trade or invest, based on the information from this website, you will be doing it at your own risk. Under no circumstances is Trendsharks responsible for any capital losses or damages you might suffer, while using the company’s products and services. For more information read our Terms & Conditions and Risk Disclaimer.


