The GBPJPY has been strengthening for five consecutive days, and it's fair to say that the price action of the pair is trending when examined on a smaller timescale. It follows that trading the GBPJPY at present would entail the implementation of trend continuation strategies, provided that the underlying market conditions remain unchanged in the next few days.
In contrast, contrarian traders are likely to be watching precisely for evidence suggesting the opposite. Chiefly, the termination of the underlying bullish sentiment in the market, and a potential formation of a new bearish downturn.
That is why the purpose of today's analysis is to examine the strength of the current bullish trend and to evaluate whether or not the price action would continue advancing further north in the foreseeable future. If so, would there be any intermittent bearish corrections, which would enable the execution of swing trading strategies? Such considerations are important because they could shed light on the appropriate approach to executing trades in the context of the current market conditions.
The analysis is also going to weigh in on whether the bullish trend is exhausting its strength, which could result in the establishment of a more sizable downturn. Accordingly, today's analysis is also going to expound upon the most crucial indications that traders need to watch for as they develop, in order to stay on top of the volatile market.
1. Long-Term Outlook:
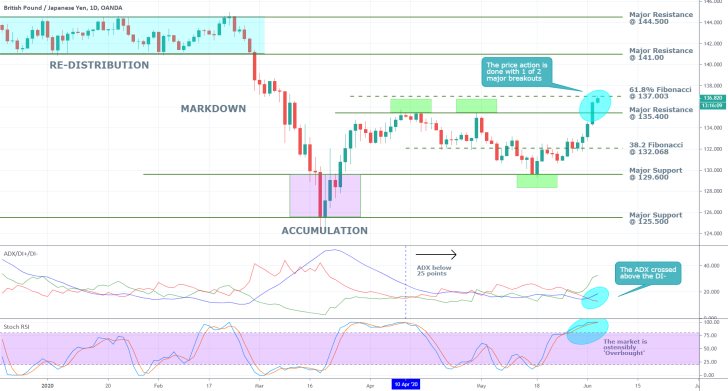
As can be seen on the daily chart below, the GBPJPY is currently attempting to break out above the boundaries of a substantial range, with an upper edge represented by the major resistance level at 135.400 and lower boundary designated by the major support level at 129.600. The latter served as an upper boundary for the previous Accumulation range, which increases its significance, while the former manifests a considerable obstacle for the underlying bullish momentum.
Hence, the recent breakout above the major resistance level there underpins the considerable bullish commitment at present and is the chief reason as to why expectations for a continuation of the underlying bullish trend's development prevail. However, the price action has to break out above one last obstacle before the strength of the evolving bullish trend can be confirmed.
The 61.8 per cent Fibonacci retracement level at 137.003 represents the third significant steppingstone in the price action's recovery from the recent market crash (caused by the coronavirus crisis). Due to the importance of this Fibonacci retracement, therefore, contrarian traders would be looking for indications that the price action would not manage to continue heading higher and that a reversal is imminent.

Due to the aforementioned massive size of the underlying range, the price action is still technically range-trading on the daily chart, which is why the ADX remains threading below 25 points. Nevertheless, the indicator has recently crossed above the DI-, which is an early sign of increasing bullish commitment in the market. If this behaviour continues in the near future, then the market could be said to be currently transitioning from a decidedly range-trading environment into a trending one.
Meanwhile, the Stochastic RSI illustrates the massive buying pressure in the market, which could continue driving the underlying price action further north. However, if the market bears see evidence that the price action might be consolidating just below the 61.8 per cent Fibonacci retracement level, they could use the RSI, which is at its 'Overbought' extreme at present, as an indication for the execution of short orders on the anticipation of a newly developing trend reversal.
At any rate, should the price action manage to successfully break out above the 61.8 per cent Fibonacci retracement level at 137.003, then the next major target-level for the evolving bullish trend would be the major resistance level at 141.000. Conversely, if the price action rebounds from the resistance level at the 61.8 per cent Fibonacci, then the next target level for the newly established dropdown would be the 38.2 per cent Fibonacci retracement level at 132.068.
2. Short-Term Outlook:

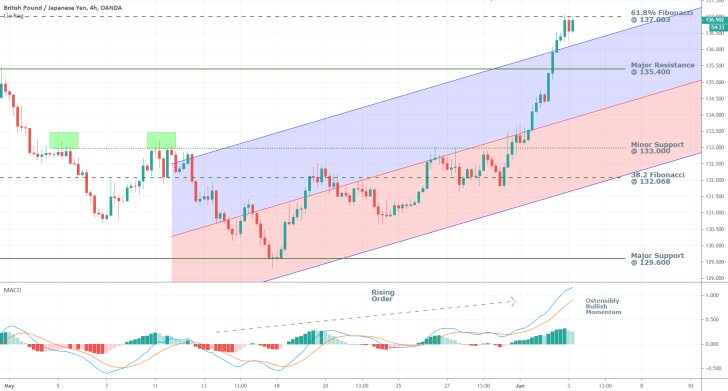
As can be seen on the 4H chart above, the bullish price action is picking up steam in the short run. It has even managed to break out above the ascending channel's upper boundary, which is illustrative of firm commitment. Despite this almost vertical appreciation, however, even this bullish upswing is not exempt from corrections.
Seeing as how the price action is contained within the 61.8 per cent Fibonacci and the significant resistance level at 135.400 (presently serving as a support), the timing now might be ideal for the development of one such minor correction. This assertion is supported by the fact that the GBPJPY cannot indefinitely continue advancing vertically, and a downswing should eventually emerge. The time now seems perfect for this, due to the many crucial SRLs in close proximity to the current market price. Notice that such a retracement is not necessarily going to indicate a trend reversal pattern. Instead, such a correction could form a swing low as soon as it reaches the major support level at 135.400 before the bullish trend can continue going higher.
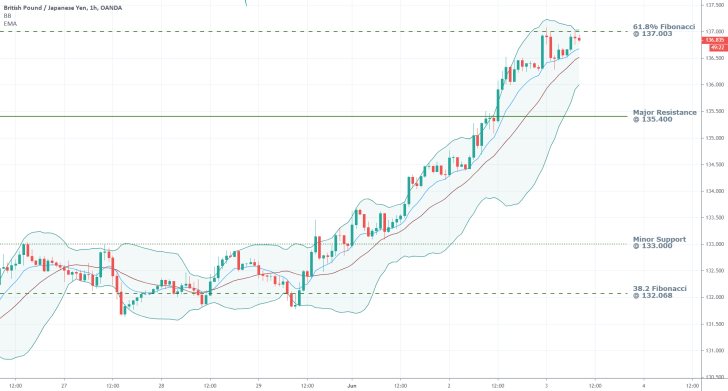
As can be seen on the hourly chart below, the Bollinger Bands are already narrowing down, which is demonstrative of waning volatility in the market. This, in turn, favours the development of short-term bearish corrections. Moreover, the upper Band coincides with the 61.8 per cent Fibonacci retracement level, which represents yet another major obstacle that would make a breakout even more difficult.
Should the 10-day EMA cross below the middle BB line, this would be indicative of prevailing selling pressure in the market. Thereby, it could also indicate the beginning of a new bearish correction.

3. Concluding Remarks:
Overall, the GBPJY's price action appears to be exhibiting decidedly bullish behaviour; however, traders who haven't already joined the market should not rush to do so now. Instead, trend continuation strategies should be applied carefully, and the best time to go long would be after the price action reaches a new swing low of a new bearish correction.
Accordingly, if the price action appears to struggle with breaking out above the 61.8 per cent Fibonacci retracement level, then traders should consider whether or not the underlying sentiment has changed even more drastically. Such turn of events could potentially signify a new trend reversal and the preservation of the aforementioned broad range.

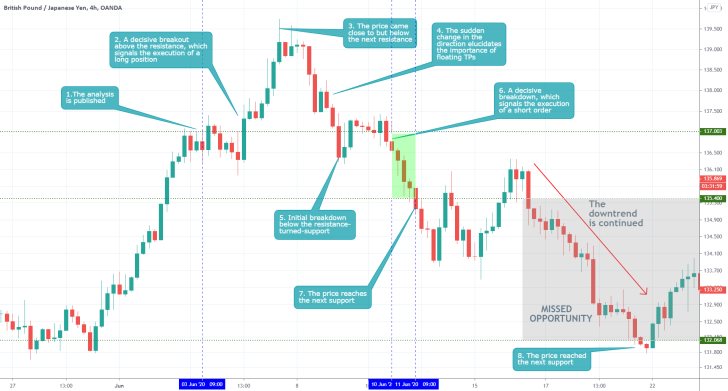
- The analysis correctly outlined the prevailingly bullish sentiment in the market at the time of publication, as well as the relevant levels of support and resistance as potential turning points for the direction of the price action. The conditions for opening a trend-continuation trade were quite properly delineated, however, the analysis failed to highlight the importance of implementing a floating take-profit order when joining an existing trend.
- The analysis was also quite successful in describing the conditions under which the market sentiment would change, which allowed for the execution of a trend-reversal trade.
Disclaimer: Your capital is at risk! Trading and investing on the financial markets carries a significant risk of loss. Each material, shown on this website, is provided for educational purposes only. A perfect, 100% accurate method of analysis does not exist. If you make a decision to trade or invest, based on the information from this website, you will be doing it at your own risk. Under no circumstances is Trendsharks responsible for any capital losses or damages you might suffer, while using the company’s products and services. For more information read our Terms & Conditions and Risk Disclaimer.


