The GBPCHF pair has been trading in a relatively narrow range for the past several weeks due to lower trading activity during the summer months. However, the pair also appears to be building momentum as it is currently in the early stages of creating a new directional swing.
Heightened volatility can be anticipated to affect GBPCHF's price action in the near term due to two crucial developments. Firstly, the number of global coronavirus cases continues to rise rapidly, which threatens the fragile global recovery as governments might refrain from easing their containment restrictions and reintroduce more stringent lockdown policies.
For reference, the US added nearly 55 thousand new cases yesterday, while China reports the biggest spike since the termination of the lockdown in Wuhan. A sizable surge in Spanish cases also manifests a concern for European leaders.
While the outlooks in the UK and Switzerland are nowhere near as severe, the global fallout from a potential second wave could indirectly affect the two economies because of the interconnectedness of the global supply chains. This, in turn, is likely to impact the values of the two respective currencies, as traders start to weigh in on the likelihood for a similar downturn akin to the one witnessed in February through March.
Secondly, the recent landmark deal in the EU concerning the issuing of common European debt to tackle the crisis, has boosted the value of the euro, which consequently affected the dollar negatively. The volatile price action of the EURUSD has a noticeable spillover impact on other majors, which is also prevalent on the GBPCHF pair.
Both factors are expected to continue inflating the underlying volatility of the GBPCHF as the pair's price action prepares to break out of the recent deadlock.
1. Long-Term Outlook:
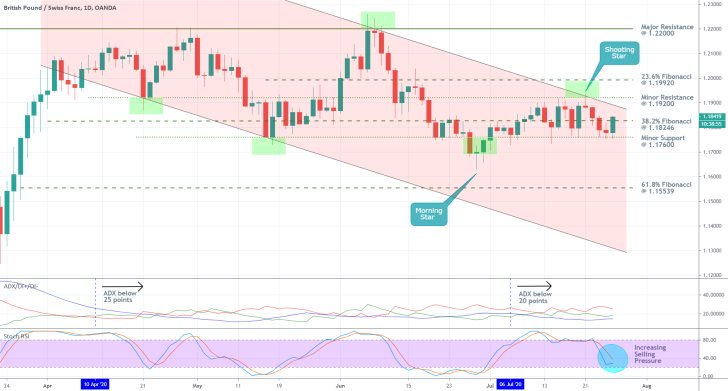
As can be seen on the daily chart below, GBPCHF's price action is currently consolidating in a tight range spanning between the minor resistance level at 1.19200 and the minor support level at 1.17600. Moreover, the pair is nearing the upper boundary of a descending channel, which is why the muted price action is expected to be terminated soon.
The GBPCHF has been floating around the psychologically important 38.2 per cent Fibonacci retracement level at 1.18246 for several weeks now, which underlines the current undecidedness of the market. Yet, this is the first time in a while that the price action is also concentrated around one of the channel's two extremes. The last time this happened was in early June when the price action rebounded from the upper boundary and created a new sizable downswing.
Given this previous behaviour of the pair coupled with the establishment of a shooting star just a few days ago, the development of a new such downswing seems highly probable. The price action would have to break down below the 1.17600 before it could attempt falling towards the 61.8 per cent Fibonacci retracement level at 1.15539. These are the longer-term projections; however, the outlook is slightly different in the short run.
As it is about to be seen below, the underlying sentiment is prevailingly bullish at present, which means that the price action could spike up towards the resistance at 1.19200 before the sentiment changes.

Such seemingly sporadic fluctuations are to be expected in this highly pronounced range-trading environment, which can be determined from the reading of the ADX indicator. As can be seen, the ADX has been threading below the 25-point benchmark since the 10th of April, and below the 20-point mark since the 6th of July.
Hence, the current conditions do not favour directional trading, which means that the creation of a new major downswing is likely to be accompanied by more adverse fluctuations as the underlying market sentiment transitions from range-trading into trending.
2. Short-Term Outlook:
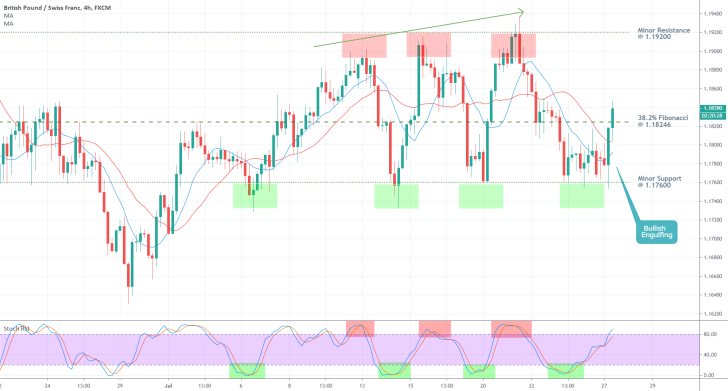
Before longer-term traders can exploit the opportunities for trading on a newly emerging downtrend, shorter-term traders could benefit from the current range-trading opportunities. So far, the price action has rebounded each time it neared one of the aforementioned range's two limits - three times from its upper edge and four times from its lower edge. This can be seen on the 4H chart below.
This means that the bears could wait for the current upswing to be terminated in order to enter the market short, on the expectations for a fourth reversal around the minor resistance level at 1.19200. Given the ostensibly range-trading environment, the Stochastic RSI indicator becomes a pretty good determinant for such likely reversals. As can be seen on the chart below, there is a pretty solid correlation between the observed reversals and the number of times the indicator has entered into one of its two extremes.

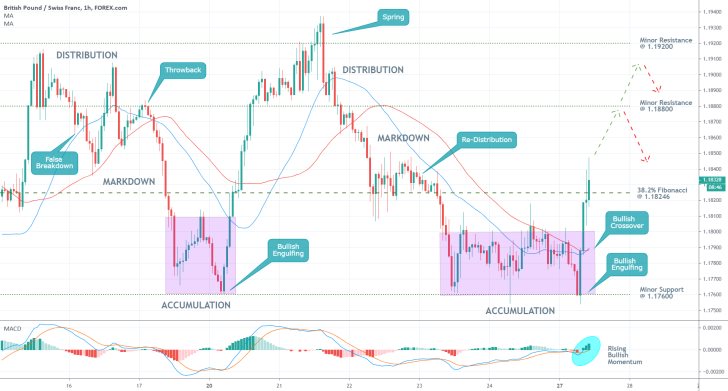
As regards the hourly chart below, the GBPCHF is clearly in the process of developing a new Markup towards the previous two Distribution ranges, which occupy the area between the minor resistance level at 1.19200 (which is shared with the broader range on the daily chart) and the minor resistance level at 1.18800. Depending on the strength of the bullish commitment at present, this Markup could reach one of the two before a new reversal takes place.
These expectations are further substantiated by the fact that the upper boundary of the aforementioned depreciating channel (as seen on the daily chart above) is currently positioned within the same area. When the three charts are considered together, the underlying expectations for a reversal to take place within this area start to seem more than likely.

3. Concluding Remarks:
The long-term outlook of the GBPCHF looks more bearish than bullish, which entails the probable creation of a new downtrend towards the 61.8 per cent Fibonacci retracement. However, the situation in the short-term is slightly different. At present, the pair is rising due to prevailingly bullish sentiment. Based on the previous behaviour of the price action, this upswing is likely to be terminated shortly, which underscores the opportunity for the market bears to enter short once the price action develops a new peak.

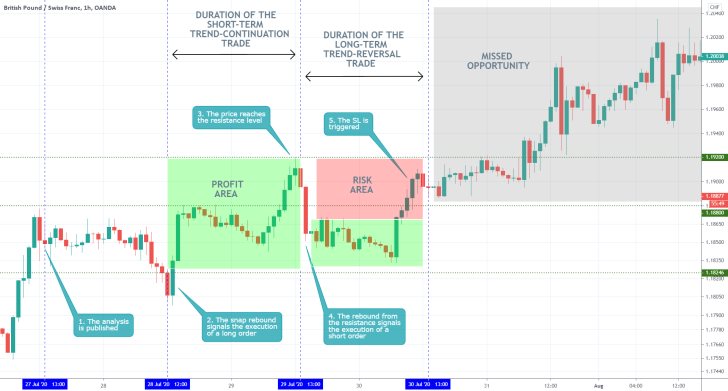
- The analysis misconstrued the underlying fundamentals affecting the pair at that time. The short-term projections regarding the likely formation of a bullish upswing, however, were really accurate. The analysis could have done more in delineating the trading opportunities for the implementation of trend-continuation strategies.
Disclaimer: Your capital is at risk! Trading and investing on the financial markets carries a significant risk of loss. Each material, shown on this website, is provided for educational purposes only. A perfect, 100% accurate method of analysis does not exist. If you make a decision to trade or invest, based on the information from this website, you will be doing it at your own risk. Under no circumstances is Trendsharks responsible for any capital losses or damages you might suffer, while using the company’s products and services. For more information read our Terms & Conditions and Risk Disclaimer.


