The GBPCAD's price action is currently undergoing through a transitionary stage – the existing range-trading environment is about to become trending. This process is not going to be finished overnight; however, being aware of the long-term trends would allow traders to exploit all present and future trading opportunities.
As it is about to be seen below, the GBPCAD is currently in the early stages of establishing a new bullish trend. This underlying scenario could be exploited in different ways, depending on the trader's preferred timescale. Therefore, the purpose of today's analysis is to illustrate the longer-term trading opportunities concerning the expected emergence of a new bullish trend. Additionally, contrarian trading opportunities in the short-term are also going to be outlined.
1. Long-Term Outlook:
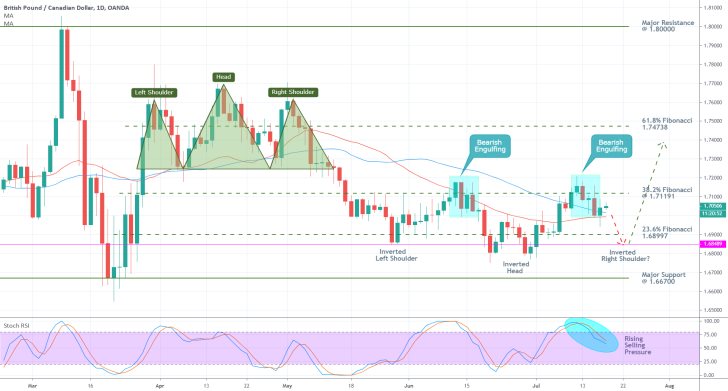
As can be seen on the daily chart below, the underlying market sentiment has already morphed once in the wake of the initial coronavirus crash. The previously bearish market outlook was subsequently overtaken by the presently subdued range-trading conditions. The underlying range spans between the 38.2 per cent Fibonacci retracement level at 1.71191, which serves as its upper boundary, and the 23.6 per cent Fibonacci retracement level at 1.68997, which represents the range's lower boundary.
Notice the Head and Shoulders pattern, from which the last significant dropdown was subsequently transformed into the aforementioned range. It signifies the underlying market pressures that are prompting the price action to behave as it does. As can be seen, the GBPCAD is currently acting in a similar manner, with the only difference being that the newly emerging Head and Shoulders pattern is inverted.
The Inverted Head's deeper bottom followed the Inverted Left Shoulder. Afterwards, the price action attempted to go higher, but it rebounded from the 38.2 per cent Fibonacci. The last two peaks, which are represented by the blue rectangles, outline the neckline of the Inverted Head and Shoulders Pattern. All of these observations are important because they can be used to project the likely future behaviour of the GBPCAD.
If the Inverted H&S Pattern is to be concluded, then we can anticipate a new dropdown towards the 23.6 per cent Fibonacci retracement level (or the 1.68489 price level represented by the purple horizontal line), which would signify the completion of the Inverted Right Shoulder. These assertions correspond to the aforementioned opportunities for contrarian trading.
Afterwards, the longer-term expectations concerning the emergence of a new bullish trend can begin to be realised. The price action would have to rebound from the Right Inverted Shoulder's bottom, and then start rising further north. The longer-term target level for such a bullish trend is encompassed by the 61.8 per cent Fibonacci retracement level at 1.74738.

Two crucial factors substantiate the expectations for a new dropdown in the short run. Firstly, notice the blue rectangles once again. They are virtually the same – a bearish engulfing candle being followed by a temporary consolidation. The development of the Inverted Head followed the first bearish engulfing candle. Therefore, the price action can be anticipated to behave in a similar fashion yet again.
Secondly, the Stochastic RSI indicator has recently fallen below the 'Overbought' extreme, which indicates rising selling pressure.
Nevertheless, certain obstacles could hinder the creation of such a dropdown. The most recent retracement (the one following the last bearish engulfing) remains concentrated above the 50-day MA (in blue) and the 30-day MA (in red). The two moving averages serve as floating supports, and if the GBPCAD remains trading above them, then the likelihood of a new dropdown would be significantly diminished.
2. Short-Term Outlook:
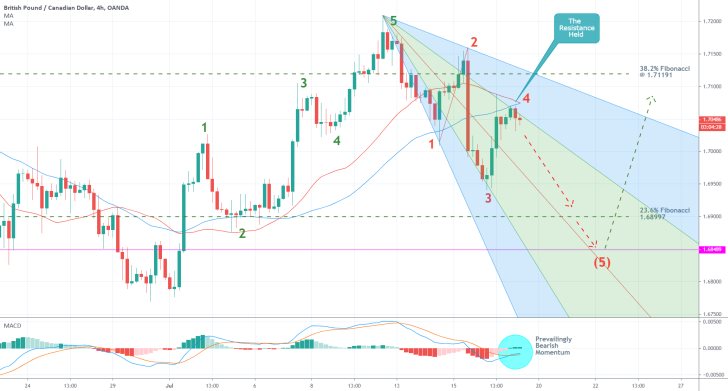
The establishment of the Inverted Right Shoulder was commenced after the bullish 1-5 impulse wave pattern was concluded, as can be seen on the 4H chart below. Afterwards, a new bearish 1-5 impulse pattern started developing, which is inlined with the primary expectations for a new dropdown.
The 3-4 retracement leg is already finished, which means that the final 4-5 impulse leg can now start developing. These assertions are confirmed by the fact that the price action remains concentrated within the middle part of the pitchfan tool.
Accordingly, the price action tested but failed to break out above the two moving averages, which are serving as floating resistance levels on the 4H chart. Overall, the peak at point 4 is now likely to be followed by a new downswing towards the 1.68489 price level - the possible level for the bottom at point (5).
Moreover, the MACD indicator illustrates the prevailing bearish momentum in the market, which supports the primary expectations.

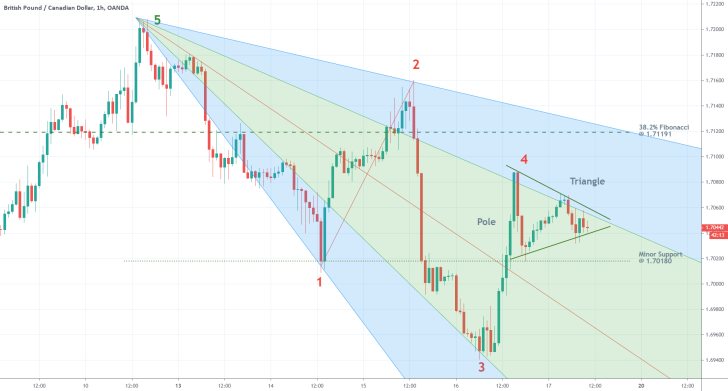
Finally, the hourly chart below illustrates the rising bearish sentiment at present. As can be seen, the price action is currently contained within the boundaries of a triangle pattern, which has one of the pitchfan tool's intermediate lines as its upper boundary. Once the price action manages to break down below the triangle, this would represent an additional confirmation of the bearish sentiment's robustness.

3. Concluding Remarks:
Market bears can look to open selling orders in the short run on the anticipation for the development of a new downswing. This would lead to the successful conclusion of the Inverted Head and Shoulders Pattern. However, they should keep in mind that the longer-term outlook of the pair is prevailingly bullish.
The market bulls, in turn, should be cautious and wait before they go long on the GBPCAD. They can do so only after the dropdown is fully completed.
Disclaimer: Your capital is at risk! Trading and investing on the financial markets carries a significant risk of loss. Each material, shown on this website, is provided for educational purposes only. A perfect, 100% accurate method of analysis does not exist. If you make a decision to trade or invest, based on the information from this website, you will be doing it at your own risk. Under no circumstances is Trendsharks responsible for any capital losses or damages you might suffer, while using the company’s products and services. For more information read our Terms & Conditions and Risk Disclaimer.


