The GBPUSD pair has been flexing muscles for quite a while now, refusing to go down just yet despite continuously mounting expectations for a new bearish correction. The reasons for the pound's strength are complex - from post-Brexit optimism to strong global demand for riskier securities. This rally is poised to cave in eventually and given this week's busy schedule, this could happen in the very near future.
First, the Monetary Policy Committee (MPC) of Bank of England is scheduled to meet on Thursday. According to the preliminary market forecasts, the Committee is unlikely to scale up its underlying asset purchase facility, which means that the pound will most probably not be strengthened by any monetary policy alterations at the present rate.
Secondly, the U.S. Bureau of Labour Statistics is next in line to release January's Non-Farm Payrolls data on Friday. Even though headline unemployment is anticipated to remain unchanged from a month prior, the U.S. labour market is still expected to have added 55 thousand new jobs in the first month of the year.
Overall, there are more reasons to weigh in on a dollar recuperation/sterling depreciation over the next several days, as the pair continues to test a major resistance level. These fundamental factors could catalyse such a long-awaited bearish correction, creating some very interesting trading opportunities.
1. Long-Term Outlook:
The most substantial piece of evidence elucidating a potential correction is formulated using Elliott Wave Theory. As shown on the daily chart below, the price action is still (since our previous analysis of the pair) in the process of finalising a bullish 1-5 impulse wave pattern (in green). The recent consolidation of the price action below the major resistance level at 1.3700 likely underpins the completion of the final impulse leg (4-5). Moreover, this leg itself comprises a minor 1-5 impulse wave pattern (in blue).
The first likely target level for such a correction is encapsulated by the minor support level at 1.34000. Its prominence stems from the fact that it was already tested on several occasions - it served as a swing high for the second impulse leg (2-3) of the broader pattern, as well as a turning point for a recent rebound (as indicated on the chart).
If the price action manages to break down below it, the next target, naturally, will be the 23.6 per cent Fibonacci retracement level at 1.32042, which is currently converging with the 100-day MA (in blue). The third and deepest target level is encompassed by the 38.2 per cent Fibonacci retracement at 1.28614.
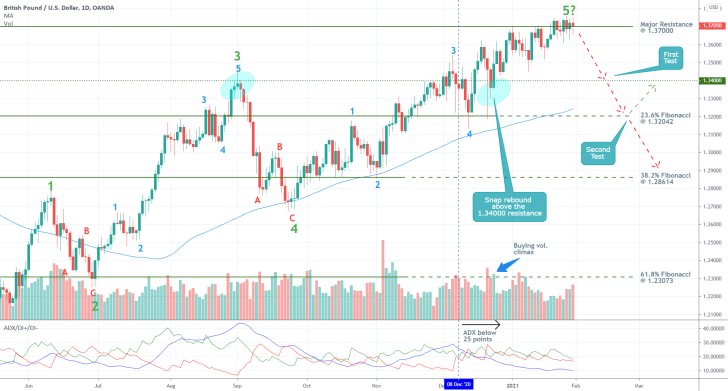
Notice that the ADX indicator has been threading below the 25-point benchmark since the 8th of December, which means that the market is currently range-trading. Not only that but at present, the underlying trend is at its weakest in over a year. This sentiment is also really favourable for the likely emergence of a new bearish correction.
Shortly after the market became ostensibly range-trading, the underlying buying volume reached a climax. That is why the aforementioned consolidation alongside the major resistance at 1.37000 has so far been unable to break out above this barrier, given the decreasing buying pressure. This represents yet another reason why a bearish correction seems imminent.
2. Short-Term Outlook:
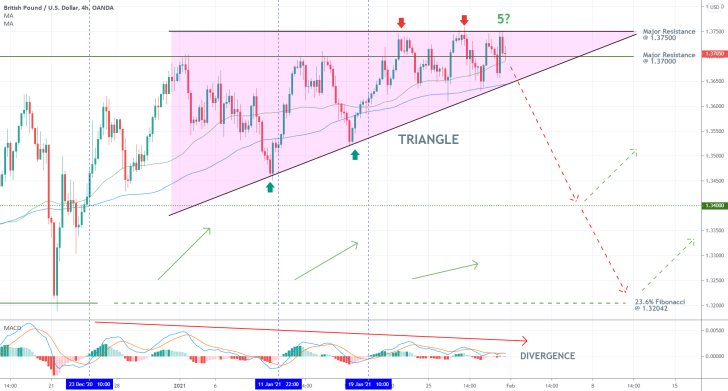
The above-mentioned consolidation of the price action is represented as an evolving Triangle pattern on the 4H chart below. The price action has already failed to break out above the Triangle's upper boundary at 1.37500 on three separate occasions and is currently drawing near to the end of the pattern. As the gap of the Triangle is gradually narrowing down, a breakdown starts to seem more plausible.
Notice that in order to confirm the beginning of a new dropdown, a decisive breakdown below the Triangle's lower boundary (ascending trend line) and the two moving averages - the 50-day MA (in green) and the 100-day MA (in blue) - will be needed.
It is also important to point out that while the underlying bullish momentum has been steadily depreciating since the 23rd of December, the corresponding price waves have been rising at an increasingly weaker pace. This type of behaviour is demonstrative of a Divergence in the making, which is to be expected if the underlying price action is about to change its direction soon.
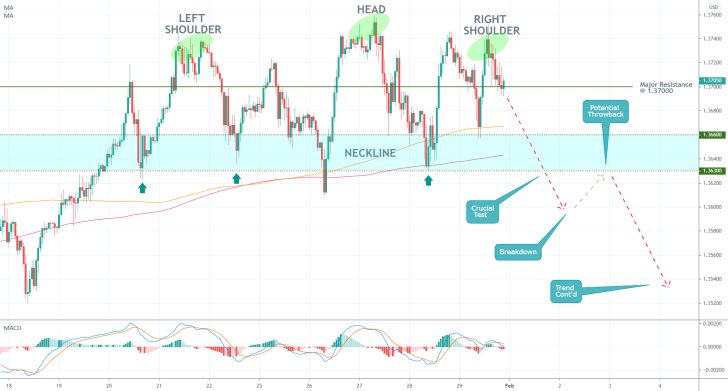
Arguably, the strongest piece of evidence justifying the expectations for a bearish reversal can be found on the hourly chart below. The price action appears to be in the final stages of establishing a Head and Shoulders pattern, which is a little bit hard to discern at first glance.
Notice that in order for the pattern to be completed, the price will have to break down below the neckline of the H&S, which is roughly positioned between the minor resistance at 1.36600 and the minor support at 1.36300. The MACD indicator once again seems to pinpoint rising bearish momentum that is inlined with such expectations. The neckline is also roughly contained within the 400-day MA (in purple) and the 300-day MA (in orange).
Keep in mind that after the first breakdown, a throwback to the neckline from below is also likely to develop. This will provide bears with an additional opportunity to sell the cable before the correction can be extended lower.
3. Concluding Remarks:
Depending on their level of risk aversion, bears could look for an opportunity to enter the market anywhere between the right shoulder and the lower limit of the neckline. The opportunities for such contrarian trading were listed above.
Bears should also keep in mind that it is entirely plausible for the expected correction to transform into a much bigger downtrend, so they should not limit their profit potentials by collecting profits at the first opportunity. However, such transformational market changes are typically characterised by heightened market volatility. Erratic price fluctuations could make trade execution imprecise around the current price before the GBPUSD is fully ready to start sliding.
What Goes Up, Must Come Down
Once again, the time seems right to look at the GBPUSD, expecting a healthy dropdown to the next support. The cable advanced considerably over the past several days since BOE's February meeting last Thursday, but that positive momentum now seems to be exhausted. Thus, the underlying price action is once again starting to exhibit mounting bearish signals.
The emergence of such a correction at the present rate would seem logical, given the slow week that we are currently having. Nevertheless, one economic release scheduled for tomorrow could have a sizable impact on the GBPUSD's price action, and that is the UK's Q4 GDP growth numbers.
The preliminary Gross Domestic Product data for the three months leading to December could temporarily stifle the demand for the cable, given the underlying forecasts for marginal growth. According to the initial market projections, Britain's economy is expected to have expanded by only 0.5 per cent in the fourth quarter of 2020.
That is how the underlying fundamental factors, though not being very pronounced, seem inlined with the expectations for a small correction of the GBPUSD in the very near term.
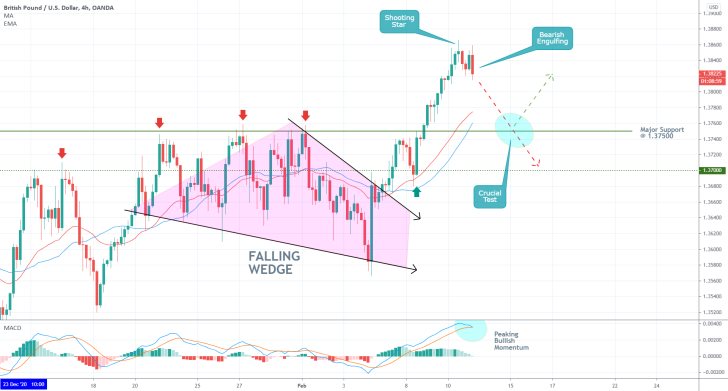
As shown on the 4H chart above, BOE's monetary policy meeting last week catalysed a breakout above the Falling Wedge, which resulted in the emergence of the last upswing. The subsequent development of a Shooting Star candle at the very top of the upswing, followed by the current Bearish Engulfing, signals the likely beginning of such a correction. Both types of candles are typically found at the top of recent uptrends and are taken to signify likely bearish reversals.
The likely completion of the recent upswing can also be substantiated by the MACD indicator, which is currently demonstrating peaking bullish momentum. In other words, if the indicator's two EMA's were to cross out each other, this would underpin rising bearish momentum.
The most likely target level for such a bearish correction is encapsulated by the major support level at 1.37500, which previously served the role of a prominent resistance. This is further substantiated by the fact that the level is currently being crossed by the 30-day EMA (in red) and the 30-day MA (in blue). A deeper correction could test the next support, which is at 1.37000.
Bears looking to take advantage of the currently evolving opportunity for contrarian trading should not let their guard down. There is always a possibility for more abrupt rebounds in the direction of the price action, which is why supporting stop-losses should be placed near the recent swing high (the shooting star).
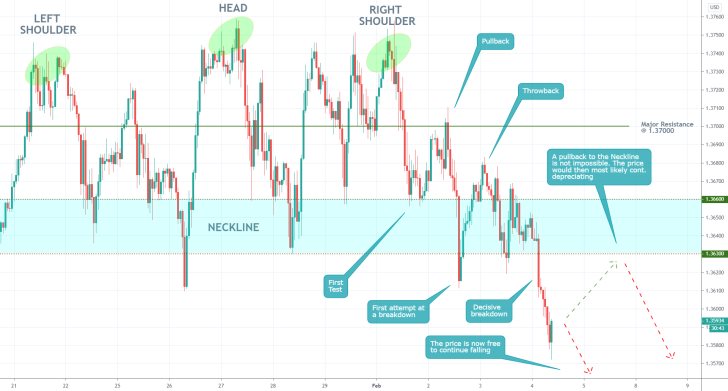
- As was projected by the initial analysis, the GBPUSD successfully established a breakout play. The cable's price action broke down below the Neckline of a Head and Shoulders pattern, which signalled the anticipated beginning of a new downtrend. The price is now free to test the first target level - the 1.34000 major support.
- It should also be mentioned that the breakdown occurred exactly as expected - following the first attempt at a breakdown, the price action then established a minor throwback. Now that a decisive breakdown has been established, the price action could retrace to the Neckline's lower boundary once more before continuing to slide afterwards. If this does occur, then bears would have an opportunity to add to their short orders at the peak of the resulting throwback (around 1.36300).
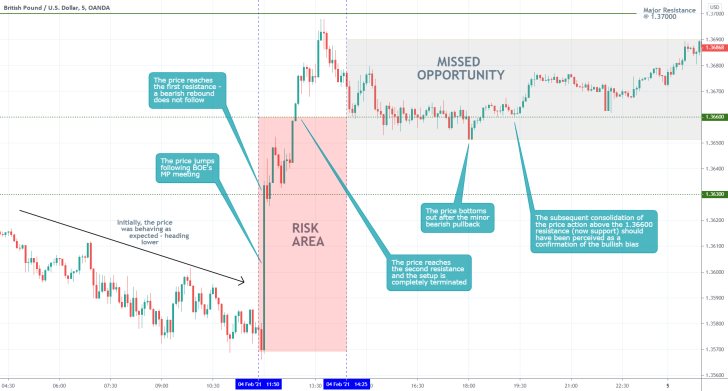
- The price action was initially behaving as per the expectations of the analysis; however, it abruptly changed its course following the conclusion of BOE's February Monetary Policy Meeting. The reinvigorated sterling was then promptly able to drive the cable towards the resistance first at 1.36300, and then at 1.36600.
- There are two major outtakes from this scenario that should be remembered. Firstly, traders are recommended to use narrow stop-loss levels when implementing trend-reversal trading strategies. Secondly, they should keep in mind that proactive trading (entering the market before a top-tier event such as BOE's meeting takes place) entails a very high degree of risk.
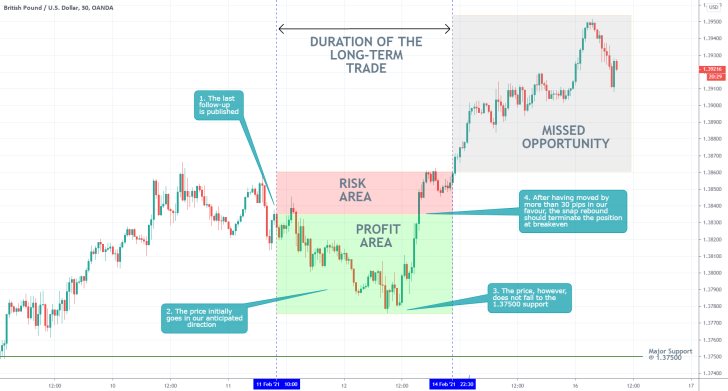
- The price initially moved in the anticipated direction, but then the cable registered a snap bullish rebound before the price action could reach the expected target level at 1.37500.
- The biggest takeaway from this setup is the need to implement tight risk management continuously. Namely, FX traders would do well to remember to move their stop-loss orders at breakeven ($0 losses) levels after the price had already moved by 30 pips in their anticipated direction.
Disclaimer: Your capital is at risk! Trading and investing on the financial markets carries a significant risk of loss. Each material, shown on this website, is provided for educational purposes only. A perfect, 100% accurate method of analysis does not exist. If you make a decision to trade or invest, based on the information from this website, you will be doing it at your own risk. Under no circumstances is Trendsharks responsible for any capital losses or damages you might suffer, while using the company’s products and services. For more information read our Terms & Conditions and Risk Disclaimer.


