The price of gold reached a new low yesterday, temporarily probing below the 61.8 per cent Fibonacci retracement level at 1690 before retracing back up. While this behaviour undoubtedly demonstrates the strength of the underlying downtrend, there are also many reasons to anticipate a reality check for the retreating commodity around the current market price.
As regards the prevailing fundamental factors, there are many developments as of late that warrant close inspection. Firstly, rising yields in the U.S. are prompting a selloff in the stock market, which is having a global spillover effect. This is generally considered to be good news for the dollar, as investors weigh in on the improving economic conditions that could force the FOMC to recalibrate their massively accommodative MP stance. The general logic dictates that a recuperating dollar is bad news for the yellow metal, as it is commonly held that the commodity has an inverse relationship with the greenback.
Indeed, gold has been retreating as of late parallel to the strengthening greenback. Nevertheless, this could change soon. Gold bulls are likely to ramp up their efforts, seeing as how the 'happy times' on the stock market are coming to an end. Their expectations for a rebound are likely to be further substantiated by the fact that gold is currently trading at a major make-it-or-break-it point, which in itself could initiate at least a temporary correction.
Despite all of the evidence to the contrary, gold bulls need to approach the trading opportunity with caution, as the commodity remains in a bearish market. If they decide to take advantage of the emerging opportunity, they will be forced to use contrarian trading strategies, which entail a high degree of risk.
1. Long-Term Outlook:
As can be seen on the daily chart below, gold indeed tested the 61.8 per cent Fibonacci retracement level at 1690.36 yesterday, which is a level that was last reached in January 2020. In addition to the fact that Fibonacci retracements are in themselves prominent turning points, the 61.8 per cent also happens to be close to the psychological support at 1700.00, making it an even stronger barrier.
Not only that, but yesterday's dip also seems to represent the lowest point of a massive 1-5 impulse wave pattern (in red), as postulated by the Elliott Wave Theory. There is a pretty strong case to be made here that a bullish correction will be the most likely outcome from a 1-5 impulse wave pattern being completed on a major Fibonacci retracement level.
Moreover, the pattern's final impulse leg (4-5) represents a smaller 1-5 pattern in itself (in green). This pattern also looks almost completed, which manifests yet another confirmation of the expectations for an immediate rebound or a correction.
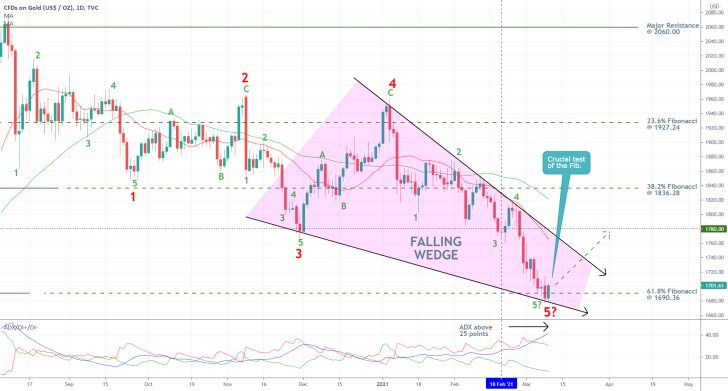
A massive Falling Wedge can be drawn from the broader 1-5 pattern's second retracement leg (3-4) and the anticipated dip at 5. Falling wedges typically entail mounting bullish bias and likely reversals from an existing downtrend, which is inlined with the expectations for the emergence of a bullish correction from the 61.8 per cent Fibonacci.
If the price action manages to break out above the Wedge's upper boundary, which is currently converging with the 20-day MA (in red), then its next most probable target will be the major resistance level at 1780.00. It is worth pointing out that the latter served as a turning point for the previous swing low (point 3 on the broader 1-5 pattern).
Finally, the ADX indicator underpins the strength of the existing downtrend, as it started advancing past the 25-point benchmark on the 18th of February. Nevertheless, this was relatively recently, which means that the likelihood of a bullish correction developing in the near future is not in any way diminished.
2. Short-Term Outlook:
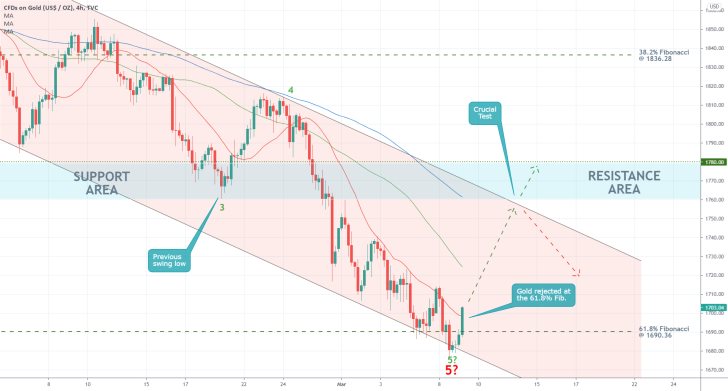
It is very rare to see existing market sentiment change overnight. It is far more common to observe gradual transitions from one trend into another, which presupposes the emergence of adverse fluctuations characterising set transition. In other words, market bulls should not hope to simply go long near point 5 and then reap the profits at a later stage. Instead, they should observe the behaviour of the price action in the short-term carefully and look for opportunities to catch the most favourable possible entries.
As can be seen on the 4H chart below, the price action is currently attempting to consolidate above 1690.36 and break out above the 20-day MA. If it succeeds, then the next most likely target will be the descending channel's upper boundary, which currently converges with the lower limit of the support-turned-resistance area (in blue). Keep in mind that sudden throwbacks to the Fibonacci support are possible at any point during the development of the correction.
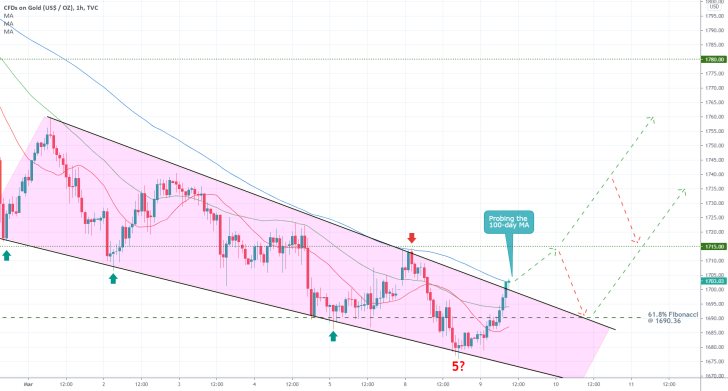
The hourly chart below reveals that the price action is currently attempting to break out above a smaller Wedge's upper boundary, which is converging with the 100-day MA (in blue). If it manages to do so, the next target will be the minor resistance level at 1715.00, which previously served as a swing low.
As stated earlier, throwbacks to the 61.8 per cent Fibonacci support could happen at any point, which is why more risk-averse traders should not rush to buy at the current market price at all costs. At any rate, unless the price action retraces back below 1690.36, they will have plenty of opportunities to join the market at a favourable price.
3. Concluding Remarks:
Bulls can start looking for an opportunity to go long around the current market price; however, they should also consider the aforementioned risks of adverse fluctuations carefully. For the time being, the target for such a correction is situated between the major resistance at 1780.00 and the lower boundary of the resistance area around 1760.00.
Traders will likely have multiple opportunities to add to their existing positions/join the market at future throwbacks, as demonstrated on the hourly chart above. Meanwhile, any decisive breakdown below the 61.8 per cent Fibonacci retracement level should be considered as a temporary invalidation of the trading opportunity.
Gold's Bullish Commitment Tested Ahead of FOMC's Meeting
Gold consolidated above the 61.8 per cent Fibonacci retracement level at 1690.36, as anticipated by the original analysis, in what looks like the initial step in the development of a new upswing. Despite this bullish development, however, the possibility of yet another bearish dropdown is still present.
The FOMC of the Federal Reserve is meeting later today, and the Committee's stance on the recently observed inflationary pressures in the U.S. will likely jolt the price of the commodity in one of two ways. The FOMC is expected to weigh in on the robust recovery in the country, which was recently strengthened by the bolstered fiscal policy of Joe Biden and his administration.
Adopting a somewhat more hawkish-sounding policy stance by the FED would likely be perceived as an early signal that the era of low interest rates may be coming to an end sooner than initially thought. This would then likely be followed by a reinvigorated interest in gold as a low-risk asset, thereby driving its price higher. Conversely, investors would relax if the FOMC refrains from implementing such actions, thereby easing the tension on the stock market.
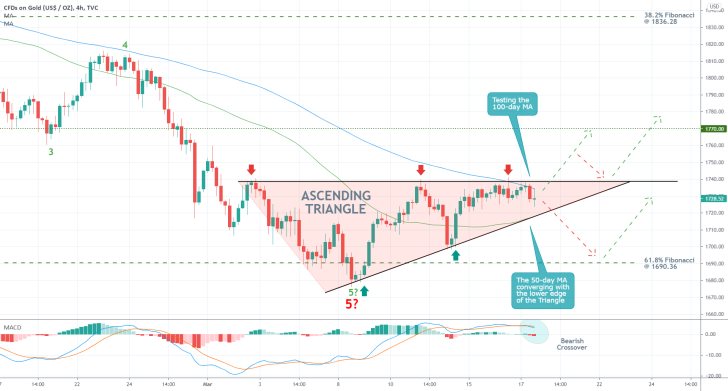
The current technical outlook of gold's price action underpins the impact of these fundamental factors, creating a crossroads of sort for the commodity. As can be seen on the 4H chart above, the price action is currently forming an Ascending Triangle pattern. This is leading to a bottleneck, which is likely to be followed by a major breakout in either direction. This is inlined with the aforementioned projections.
This bottleneck is further underpinned by the fact that the upper boundary of the Triangle is currently converging with the 100-day MA (in blue), whereas the lower boundary of the Triangle is inlined with the 50-day MA (in green). All of this is evocative of the importance of the price's current consolidation and substantiates the expectations for a decisive breakout/down away from the Triangle.
The 4H chart also elucidates the likely future developments for each scenario. If the price breaks lower, then a throwback to the 61.8 per cent Fibonacci seems highly plausible. Conversely, a breakout above the Triangle would likely be followed by an upswing to the major resistance level at 1770.00. Notice that such an upswing can be momentarily halted by the emergence of a potential pullback to the upper boundary of the Triangle from above.
Bulls should keep an eye on the underlying momentum, given the recent bearish crossover underpinned by the MACD indicator.
Gold Bulls Slowly Gain Momentum
The price of gold did not appreciate as fast as anticipated by the last follow-up, but the commodity is showing definite signs of stabilisation. The underlying bullish opportunity remains very much active.
Stocks are depreciating as investors shift their focus on securities entailing a lesser degree of risk. This trend is increasing the demand for gold noticeably, as investors' flight from stocks strengthens the appeal of commodities. A global pick-up in demand underpins this process, accompanied by a parallel upsurge in consumption.
Overall, global recovery, though bumpy and uneven, is going faster than initially expected. This is likely to cap gold's losses and possibly initiate a new uptrend for the price of the commodity.
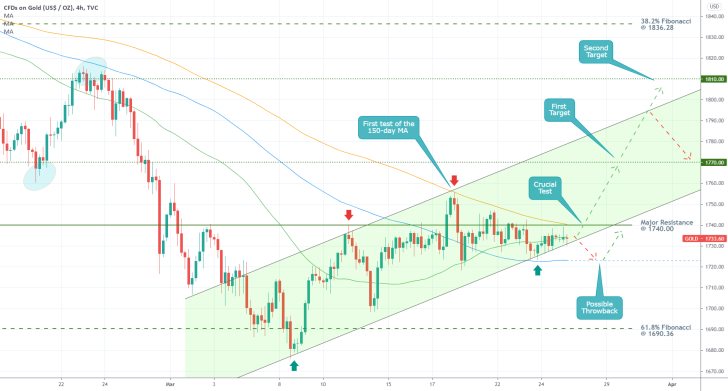
As regards gold's current technical outlook, several factors warrant close inspection. First, the price action appears to be consolidating in an increasingly narrower range, which is a likely precursor to a subsequent upswing. Namely, the price action is consolidating just below the major resistance level at 1740.00 and the 150-day MA (in orange). It is also threading above the ascending channel's lower boundary and the 50-day MA (in green).
The resulting bottleneck, underpinned by decreased volatility, entails a very probable breakout in either direction. On the one hand, if the price action manages to break out above the major resistance level at 1740.00 successfully, then it would be free to probe the next target level at 1770.00 (previous swing low). On the other hand, if it falls below the ascending channel's lower edge, it can then try to find support from the 100-day MA (in blue). The latter, which is currently horizontal, establishes a temporary support at around 1722.00. Any decisive breakdowns below it would mean that the buying opportunity would then be terminated.
Therefore, bulls would be wise not to place stop-loss orders that are a lot deeper than 1722.00. Meanwhile, they stand a good chance to catch the next massive upswing, provided that the price action does indeed manage to break out above the bottleneck.
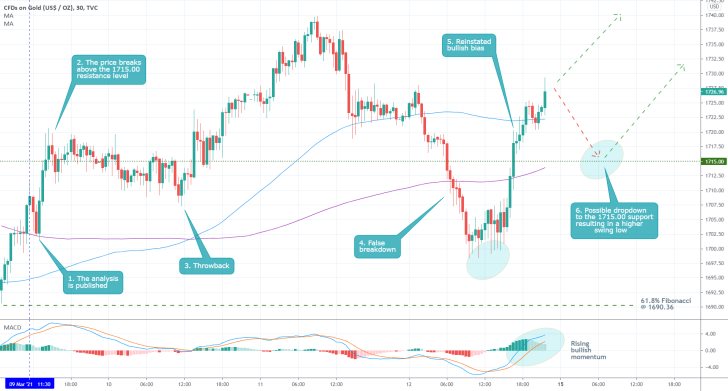
- As anticipated by the projections of the last analysis, the price of gold consolidated above the 1715.00 resistance following several false breakdowns. This behaviour of the price action manifests the first stage in the emergence of a new likely uptrend.
- Market bulls can now consider recalibrating their SLs by moving them somewhere between the 61.8 per cent Fibonacci retracement level and the last swing low.
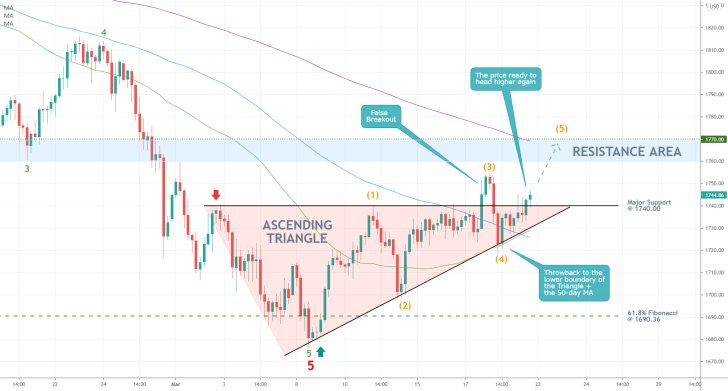
- The price action of gold is on track to realising the expectations of the last follow-up. Following the establishment of a false breakout during the last meeting of the FED, the price action retraced to the lower boundary of the Triangle. The latter was converging with the 50-day MA (in green) at the time, which made it an even more prominent support.
- The currently emerging breakout confirms the mounting bullish pressure. Moreover, the underlying upswing is taking the form of a minor 1-5 impulse wave pattern (in orange), as postulated by the Elliott Wave Theory. Thus, there is more confirmation to support the expectations for a test of the 1770.00 resistance next. This is also substantiated by the fact that the upper boundary of the Resistance Area (at 1770.00) is currently being crossed by the 200-day MA (in purple).
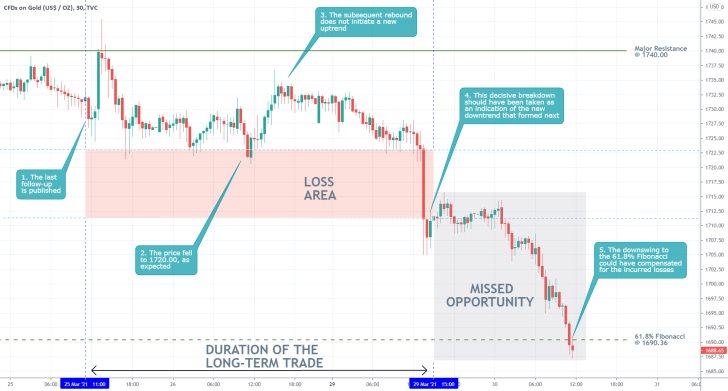
- The expectations of the last follow-up were not realised at all. The price of gold initially started to consolidate above 1720.00, which was anticipated; however, the upswing was not extended any further. The subsequent dropdown was not taken into consideration, which is arguably the biggest mistake of the setup.
- Everybody makes false projections every once in a while, which is not something to ponder on for too long. The biggest takeaway here is the need for traders to constantly look out for changing market biases and pressures.
- The incurred losses could have been mitigated easily if the dropdown had been perceived on time as an indication for the beginning of a new downswing.
Disclaimer: Your capital is at risk! Trading and investing on the financial markets carries a significant risk of loss. Each material, shown on this website, is provided for educational purposes only. A perfect, 100% accurate method of analysis does not exist. If you make a decision to trade or invest, based on the information from this website, you will be doing it at your own risk. Under no circumstances is Trendsharks responsible for any capital losses or damages you might suffer, while using the company’s products and services. For more information read our Terms & Conditions and Risk Disclaimer.


