Similarly to the stocks of other companies that we have already analysed during the current earnings season, Facebook is a particular type of an internet-based, technology company that is most likely going to benefit from heightened users' retention during the coronavirus pandemic. As more and more people globally are forced to stay in their homes and avoid contact with other individuals, the amount of time they spend on social media, and the internet in general, is increased markedly.
In Facebook's case, however, the more time users spend on the platform is not necessarily linked to a proportionate increase in the company's revenue streams. Three crucial metrics are going to take the spotlight in Facebook's earnings report for the first quarter of 2020, which is scheduled for release tomorrow after the market close. The number of Daily Active Users (DAUs); the number of Monthly Active Users (MAUs); as well as the Average Revenue Per User (ARPU).
Given the unprecedented nature of the current situation, the relationships between these metrics could potentially be altered, compared to the recorded performances during previous earnings releases. That is why the purpose of today's analysis is to examine the likely impact the findings of each of these components are going to have on Facebook's share price.
1. Long Term Outlook:
As is the case with most other companies, the increased underlying volatility that is caused by the coronavirus-related uncertainty on the market is affecting the price action of Facebook's shares. That is why recognising the most prominent support and resistance levels on a long-term chart, such as the weekly chart below, is of crucial importance. Such levels are frequently tested by the sporadic price fluctuations caused by the aforementioned volatility, so they act as notable turning points for the direction of the underlying price action.
The disruptions on the global financial markets brought about by the outbreak of the coronavirus pandemic have prompted the recent stock market selloff, which affected Facebook's shares as well. The resulting rout is a retracement from the preceding bullish market, which established a massive uptrend from the first Accumulation range to the last Distribution range. Consequently, the Fibonacci retracement levels of this uptrend represent such prominent support and resistance levels.
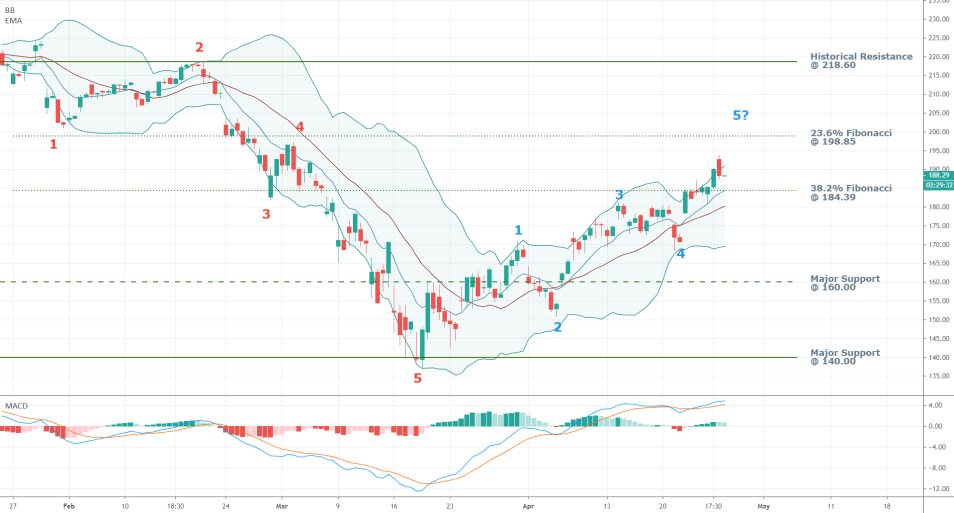
Currently, Facebook's shares are trading close to 187.50, which is positioned between the 23.6 per cent Fibonacci retracement level at 198.85, and the 38.2 per cent Fibonacci retracement level at 184.39. The former is serving as a resistance level, and the latter is a support level. Hence, any turbulent spikes in the underlying price action are likely to be contained within the boundaries of this resulting range.
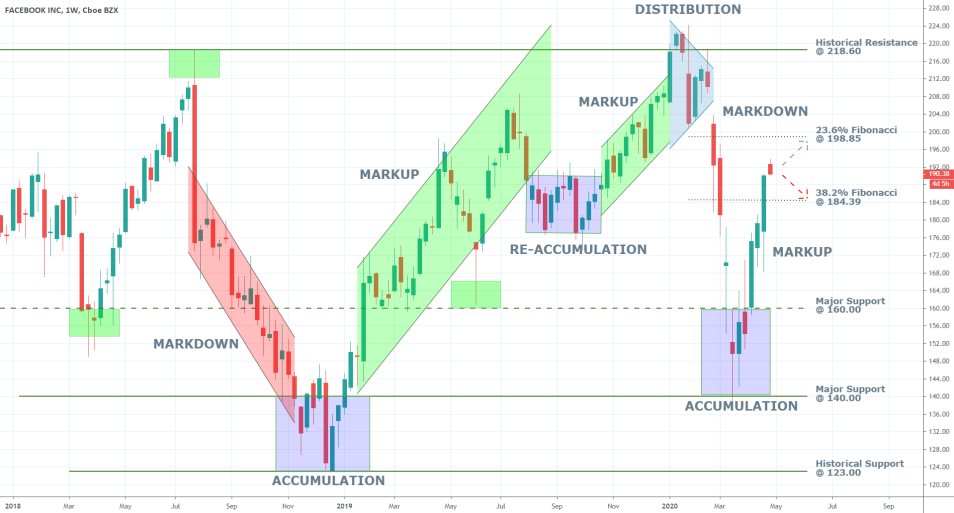
If the price action manages to break out above the resistance, or correspondingly break down below the support, such behaviour would be illustrative of significant market commitment for directional price action. In other words, a breakout above 198.85, or at any rate above the psychologically important resistance at 200.00, would underpin the huge probability for further gains up north. Conversely, a breakdown below 184.39 would manifest the likelihood of a new bearish trend's formation.
In the first scenario, the continuation of the currently developing rally could face its next major obstacle when the price action reaches the historical resistance level at 218.60, which served as an upper boundary for the last Distribution. In the second scenario, a new bearish trend could continue falling until the price action reaches the major support level at 160.00, which served as an upper boundary for the last Accumulation range.
2. Earnings Per Share; User Activity, and Average Revenue Per User:
The fundamental factors currently affecting Facebook's price action are going to be represented in the earnings report tomorrow. That is why we are now going to outline the individual importance of each one of these factors, as they appear in the report:
- Earnings Per Share. Even though Facebook investors typically do not consider this the most essential factor, the EPS data remains a crucial gauge for each company's welfare, which is especially relevant during an ongoing economic recession.
The consensus forecasts project the EPS for this year's first fiscal quarter to reach $1.76, which would be lesser than the recorded data for Q4 2019 ($2.56), but much bigger compared to the $0.85 reported for the same period last year. Naturally, if the company reports better-than-expected earnings, this would affect its share price positively. The opposite will be the case if the delivered data misses the initial market expectations.
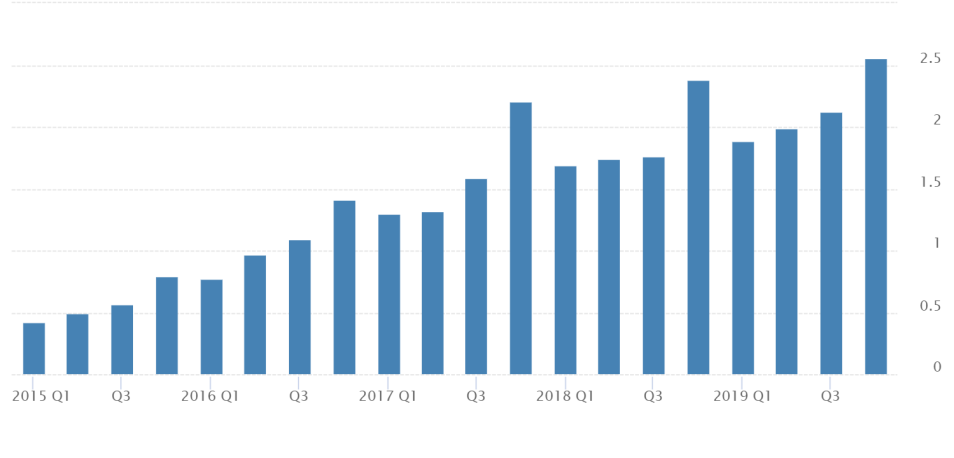
Last quarter Facebook recorded total revenue of $21.08 million, of which $20.73 came from advertising. This underscores the social media giant's dependence on solid customers' retention for maintaining the revenue streams coming from advertising on its platforms. That is why the next several metrics play such a crucial role in determining whether Facebook has had a successful quarter or not.
- Daily Active Users (DAUs). According to the company's previous statement, the number of DAUs averaged 1.66 billion in the three months leading to December 2019, which measured a yearly increase of 9 per cent. Of these, 294 million were in Europe, and 190 million were in the US & Canada. The two regions are arguably the most important ones for Facebook, because the company earns the most capital per user from Canada, the US, and Europe, as it is about to be seen below.
The number of DAUs is expected to have increased sizably over the last several weeks, due to the national lockdowns globally. Hence, Facebook's share price should appreciate if the reported DAUs for Q1 of 2020 increase beyond 1.66 billion. More importantly, however, investors would be hoping to see a marked increase in the number of DAUs in Europe, the US, and Canada.
- Monthly Active Users (MAUs). This metric plays a very similar role to the one above, but the underlying period is different. Moreover, the recoded MAUs manifest the number of committed Facebook users, which represent the company's long-term goals for building a strong followers base. Therefore, this number is an important gauge of the company's dedicated users, and also a representation of the steady source of revenue streams.
Last quarter, Facebook's MAUs on average were 2.50 billion, which measures an 8 per cent increase on a year-over-year basis. Of these, 248 million were the MAUs in the US & Canada, and 394 million were the MAUs in Europe. Naturally, if it is shown that these two segments of the MAUs report have increased in the three months to March, this would be advantageous for Facebook's share price.
- Average Revenue Per User (ARPU). On average, last quarter Facebook earned $8.52 per user worldwide, so even if it is demonstrated that this number has not changed in the previous three months, an increase in the DAUs and MAUs would still result in a positive outcome for the company.
In Q4 of 2019, Facebook generated $41.41 from each user in the US and Canada and $13.21 from each user in Europe. On average, users from the rest of the world contributed between $2.50 and $3.50 to Facebook's revenue streams. Hence, investors would be most interested in seeing whether the number of DAUs in the US & Canada has increased over the last quarter, in addition to the ARPU for the same region. Potentially positive increases in both of these segments, resulting from the lockdowns in the two countries, are going to have the most significant impact on the likely bullish price action of Facebook's shares that is going to follow the earnings report's release.
3. Short Term Outlook:
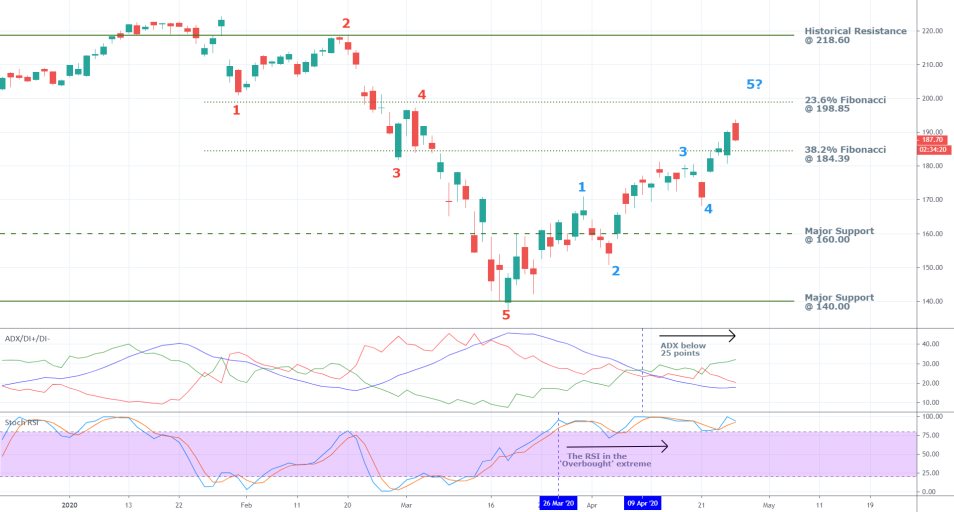
As can be seen on the daily chart above, the ADX is currently threading below 25 points, which means that the market is technically range-trading. Despite this somewhat muted commitment of the recent rally, the price action appears to be advancing in a classic 1-5 impulse wave pattern. The final 4-5 impulse leg looks like it's going to be established somewhere between the 23.6 per cent Fibonacci retracement level, and the 38.2 per cent Fibonacci retracement level. This confirms the assertion from above regarding the market's likely transition into a new decisive range. Once the Elliott Wave Pattern is fully established, and the market enters into this new range, the direction of the future price action is mostly going to be dependent on the success of tomorrow's earnings report.
The market's recent advance has been driven by heightened buying pressure, which can be confirmed by the Stochastic RSI, which has been threading in the 'Overbought' extreme since the 26th of March. This, of course, does not necessarily mean that a new bearish trend is due; however; the market bears might be compelled to execute more short orders as the market transitions into range-trading environment. Such behaviour, in turn, would change the underlying market pressures. The prevailing sentiment could become especially favourable for the establishment of a new downswing after the 1-5 pattern is completed if the earnings report disappoints tomorrow and misses the consensus forecasts.
The Bollinger Bands on the 4H chart below have recently started to diverge from each other, which is illustrative of rising volatility. Such behaviour is not uncommon at times when the market transitions from trending to range-trading environments, or vice versa. The 10-day EMA continues to thread above the Bollinger Bands' middle line, which illustrates the prevailingly bullish outlook in the short run. Nevertheless, traders should be cautious because joining an existing trend, especially when the underlying 1-5 wave pattern appears almost concluded, entails huge underlying risk.
4. Concluding Remarks:
Tomorrow's earnings data is going to serve as a catalyst for Facebook's future price action, which is not surprising. Traders and investors are above all else going to be watching for the aforementioned metrics, and if their expectations are met, the underlying rally is likely to persist. However, there are also strong indications pointing towards the likely waning of the prevailing bullish sentiment in the market, which could bring about the transition of the underlying price action into a new range-trading environment.
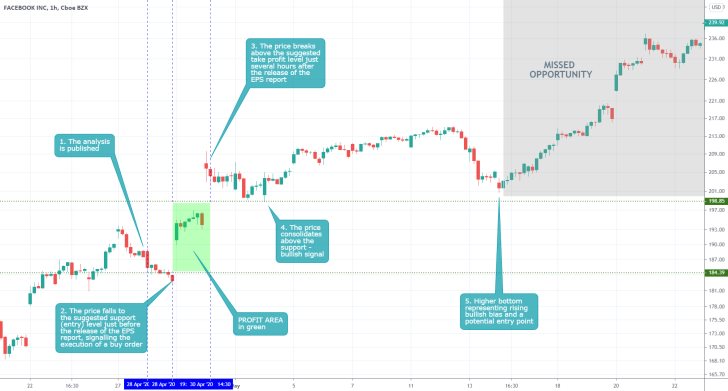
- The price behaved exactly as expected in the short-run, however, more opportunities were missed in the longer-term. The analysis could not have predicted these developments beforehand because of the unpredictability of the volatility outburst that was prompted immediately following the release of the EPS report. Hence, traders need to constantly monitor the market as it develops.
Disclaimer: Your capital is at risk! Trading and investing on the financial markets carries a significant risk of loss. Each material, shown on this website, is provided for educational purposes only. A perfect, 100% accurate method of analysis does not exist. If you make a decision to trade or invest, based on the information from this website, you will be doing it at your own risk. Under no circumstances is Trendsharks responsible for any capital losses or damages you might suffer, while using the company’s products and services. For more information read our Terms & Conditions and Risk Disclaimer.


