Ever since the coronavirus crisis started jolting the financial markets in late-February, investors and traders worldwide looked for safe-haven securities with low associated risk to protect their capitals against the spurring uncertainty. Several months into the constantly evolving situation and the Euro emerges as one of the most sought after assets. The single currency is morphing into a safe harbour for investors during those turbulent times without being typically associated with other prominent havens.
Due to this resurgence of demand for the Euro, which is additionally being supported by robust economic data, the EURCHF is one of those pairs that are likely to surge in the following weeks and months. That is why the purpose of today's analysis is to examine its price action, and to delineate the favourable levels for the execution of long positions.
1. Longer-Term Outlook:
Today's analysis begins in an unusual manner – by examining the pair's monthly chart first. This is done so that the previous assertions regarding the strengthening of the Euro can be confirmed.
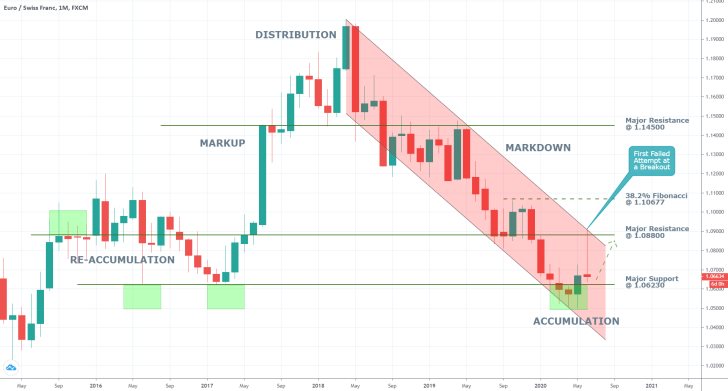
As can be seen on the price chart below, the deep markdown appears to have exhausted its bearish commitment, as the underlying price action consolidates around the major support level at 1.06230. The latter served as a lower boundary for the previous re-accumulation range, which represents the most substantial indication for the likely emergence of a new upswing.
The most recent candle rebounded from the current Accumulation range's upper boundary (represented by the major resistance level at 1.08800), which coincided with the descending channel's upper border. This was merely the first significant attempt at a breakout, and more are bound to follow, especially since this candlestick is currently adopting the form of an 'inverted hammer'.
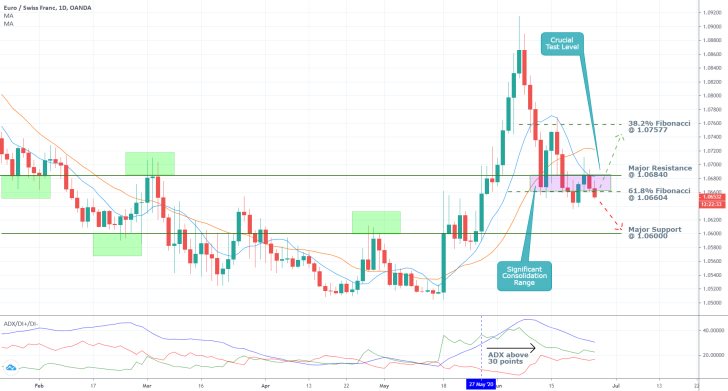
As can be seen on the daily chart below, the price action is currently consolidating in a narrow range between the major resistance level at 1.06840, and the 61.8 per cent Fibonacci retracement level at 1.06604. Should the price action manage to break out above the former, then the longer-term target level for the newly emerging uptrend would be the 38.2 per cent Fibonacci retracement level at 1.07577. Conversely, a breakdown below the latter would entail a likely dropdown towards the major support level at 1.06000. The behaviour of the price action on the monthly chart coupled with the aforementioned fundamentals seems to favour the first scenario, in which the market heads further north.
The ADX indicator, which has been threading above 30 points since the 27th of May, is demonstrative of the underlying trending environment's robustness. This represents yet another piece of evidence in support of the expectations for EURCHF's future appreciation. Nevertheless, the price action remains trading below the 10-day MA (in blue), which is positioned below the 20-day MA. This relationship is exhibitive of strong bearish sentiment in the short run, which means that the market bulls should not rush to place buying orders just whatever. Instead, they should wait and see whether the price action continues to fluctuate up and down in the immediate future before a new upswing begins to emerge.
2. Short-Term Outlook:
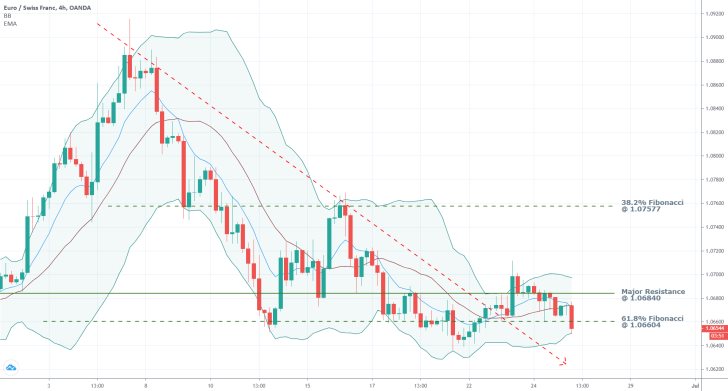
As can be seen on the 4H chart below, the price action is trading above the downwards sloping trend line, which is illustrative of strong bullish inclinations in the market, despite the rising bearish sentiment over the short-term. This is further bolstered by the fact that the 10-day EMA (in blue) remains positioned above the Bollinger Bands' middle line. Nevertheless, this relationship could be negated shortly due to the fact that the price action is currently attempting to break down below the 61.8 per cent Fibonacci retracement level at 1.06604.
The downswing could ultimately pan out to be a false breakdown because, for the time being, it fails to break down below the lower Bollinger Band. This intermediate support level could prompt a snap rebound in the underlying direction of the price action in the next several hours, which could, in turn, initiate the beginning of the anticipated uptrend.
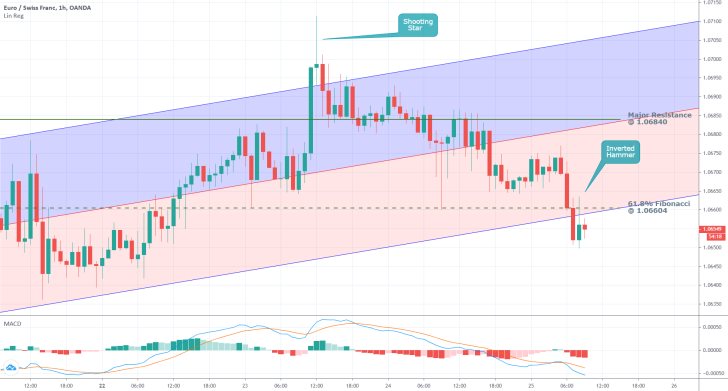
Finally, the behaviour of the price action in the very short term is quite telling as well. As can be seen on the hourly chart below, the EURCHF is presently attempting to break down below the lower edge of a minor ascending channel, which is exhibitive of the rising bearish sentiment in the very short term.
In spite of the fact that the first candle immediately following the breakdown is yet another inverted hammer, which is typically found at the lower end of a recent downswing, the price action shows no signs of stopping there. As it happens, the lower edge of the channel coincides with the 61.8 per cent Fibonacci retracement level, which marks a significant psychological barrier. In other words, the price action is likely to sink even deeper before the temporary bearish sentiment is exhausted, and the price action gets ready to resume trading higher.
The falling MACD supports these expectations as the underlying bearish momentum is becoming increasingly more pronounced.
3. Concluding Remarks:
The EURCHF is showing definite signs of preparing to form a new massive Markup in the long-term; however, the underlying market conditions look quite different on charts with lower timeframes. At present, the price action is attempting to break down below an extended consolidation range (as seen on the daily chart above), which means that the market bulls would have to wait and see how the market unfolds next.
If this breakdown turns out to be a false one, and the price action rebounds back up above the 61.8 per cent Fibonacci retracement level, this could represent the decisive piece of evidence pointing to the market's readiness to start advancing further north.
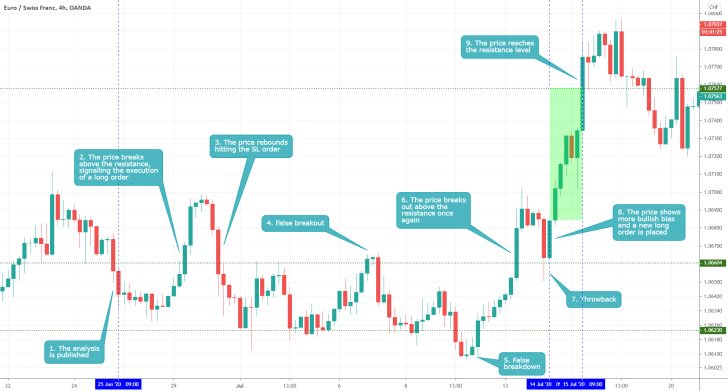
- The longer-term expectations of the analysis were realised, because the market did indeed start to appreciate shortly after the publication of the analysis. The most important contribution of the analysis was its caution for bulls to bide their time until there are definite signs that the bearish correction is completed.
Disclaimer: Your capital is at risk! Trading and investing on the financial markets carries a significant risk of loss. Each material, shown on this website, is provided for educational purposes only. A perfect, 100% accurate method of analysis does not exist. If you make a decision to trade or invest, based on the information from this website, you will be doing it at your own risk. Under no circumstances is Trendsharks responsible for any capital losses or damages you might suffer, while using the company’s products and services. For more information read our Terms & Conditions and Risk Disclaimer.


