Today is an especially important day for the GBPCHF pair due to the fact that both the Bank of England and the Swiss National Bank have scheduled monetary policy meetings. The latter already released its decision, which correlated with most of the consensus forecasts. The SNB decided to maintain its negative interest rate unchanged at -0.75 per cent.
The BOE, in turn, is scheduled to release its monetary policy decision at 1 pm UTC, which is very likely going to result in heightened volatility for all currency pairs comprising of the British pound. While the Bank is almost certainly going to keep the Official Bank Rate low, akin to SNB's ruling, the market expects the Monetary Policy Committee (MPC) to scale up its asset-purchasing programs with an additional £100 billion worth of liquidity.
Such projections are partly based on global trends already set in motion by other prominent central banks, and partly due to the weak economic performance of the British economy that was observed over the last few months. Thereby, the pivotal outcome from today's meeting of the MPC, coupled with the consequence from the already concluded gathering of the SNB, is going to set the tone for the GBPCHF's price action over the next several days and weeks.
Today's analysis delves into these consequences for the pair stemming from the two monetary policy decisions and projects the next most likely course of action for the GBPCHF's price action.
1. Long-Term Outlook:
As can be seen on the daily chart below, the longer-term underlying sentiment of the price action is defined as range-trading. The muted readings of the ADX confirm this. The indicator has been threading below the 25-point benchmark since the 9th of April, and also below the 20-point mark since the 20th of April.
All of this means that the price action remains firmly confined within the boundaries of the broader range, which has the 38.2 per cent Fibonacci retracement level at 1.17693 as its lower boundary, and the major resistance level at 1.22000 as its upper boundary. Due to this fact, breakouts or breakdowns outside of the range seem improbable for the time being. Nevertheless, the price action currently finds itself in the middle of the range, which is favourable for the implementation of swing trading strategies as the GBPCHF is likely to head towards one of the range's two limits.
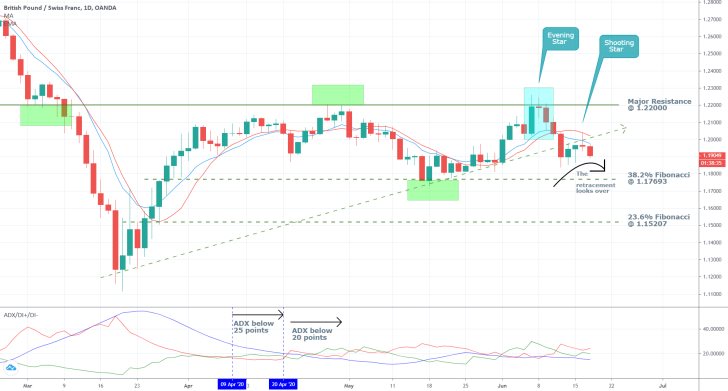
The last time the price action reached one of the range's two limits was when it rebounded from the major resistance level on the 8th of June. Notice that it did so by forming an 'Evening Star' pattern, which has an inherently bearish sentiment. This is the first significant indication as to why the price action is likely to head towards the 38.2 per cent Fibonacci retracement level next.
Secondly, GBPCHF's price broke down below the ascending trend line a few days later, which also represents a significant indication of rising bearish sentiment in the market. The subsequent retracement grazed the trend line from below but was unable to break out above it once again. It did so by establishing a 'Shooting Star' candlestick, which represents yet another bearish signal.
Finally, the 10-day EMA (in blue) is trading below the 10-day MA (in red), and the two Averages are about to cross below the ascending trend line. When this behaviour is considered in conjunction with the two previous observations, a very strong case can be built to support the expectations for a new dropdown towards the 38.2 per cent Fibonacci retracement level at 1.17693.
It should be stated that if the BOE does indeed broaden its asset-purchasing programs in the primary and secondary markets, the resulting reaction could be quite adverse. At first, the pound could be strengthened temporarily due to traders' heightened optimism; however, such a looser monetary policy is likely to erode from the currency's value in the longer term.
2. Short-Term Outlook:
As can be seen on the 4H chart below, the aforementioned 'Evening Star' pattern that was clearly discernible on the daily chart takes a different form in the shorter term. The price action's attempt at breaking out above the major resistance level at 1.22000 is encapsulated by the 'Head and Shoulders' pattern presented below. The latter is a classic trend reversal pattern indicating the termination of a pre-existing bullish trend/upswing, and it's likely follow-up – a new downswing/bearish trend.
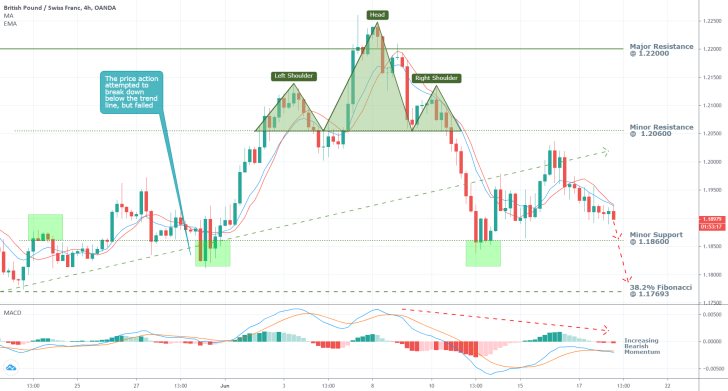
So, once the price action broke down below the pattern's neckline (the minor resistance level at 1.20600), this was a clear indication that the market was turning prevailingly bearish. The rising selling pressure affected the underlying momentum, which is also turning bearish as indicated by the MACD.
The first major obstacle for the currently evolving downswing is encapsulated by the minor support level at 1.18600, whose prominence has already been confirmed on several occasions. This level represents the most probable turning point for the underlying direction of the price action.
However, should the GBPCHF break down below it, then the next most significant target level would be the 38.2 per cent Fibonacci retracement. Once again, the importance of the latter stems from its role as a lower boundary of the prevailing range as seen on the daily chart.
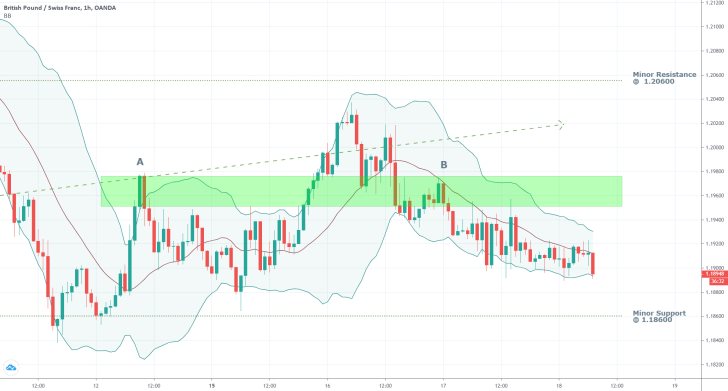
In the very short term, the price action continues falling in a tight channel spanning between the lower Bollinger Band and the BBs middle line, as can be seen on the hourly chart below. While this relationship is preserved, the downswing's establishment can be expected to continue. Nevertheless, should a bullish correction develop around the current market price or from the minor support level at 1.18600, it could extend as far as the green range. Any breakouts above it (points A and B) are going to indicate the termination of the bearish sentiment.
3. Concluding Remarks:
Expect heightened volatility in the wake of BOE's monetary policy decision later today. The market is quite likely to have an adverse reaction to the news, meaning that the immediate response could be quite different compared to the longer-term implications for the GBPCHF's price action.
Overall, while the broader range-trading sentiment is preserved, the underlying price action is likely to continue bouncing within its boundaries. It follows that the next most likely target level would be the 38.2 per cent Fibonacci retracement level at 1.17693.
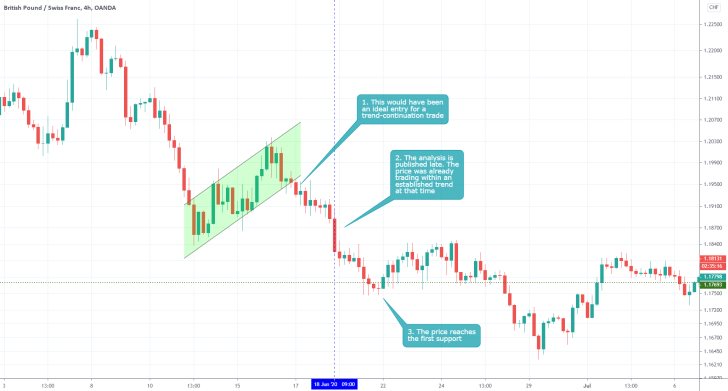
- The analysis was quite correct in arguing that the market has started developing a major downtrend around the time of publication. However, it was published relatively late for the implementation of trend-continuation strategies, which is why no trades were placed. More often than not, it is better to miss out on an opportunity, rather than to risk joining an existing trend at an unfavourable price level.
Disclaimer: Your capital is at risk! Trading and investing on the financial markets carries a significant risk of loss. Each material, shown on this website, is provided for educational purposes only. A perfect, 100% accurate method of analysis does not exist. If you make a decision to trade or invest, based on the information from this website, you will be doing it at your own risk. Under no circumstances is Trendsharks responsible for any capital losses or damages you might suffer, while using the company’s products and services. For more information read our Terms & Conditions and Risk Disclaimer.


