The remarkable, bullish run of the euro might be temporarily put on pause in light of the recent strengthening of the dollar. This does not necessarily imply that there would be a complete trend reversal on all currency pairs involving the euro. Rather, the shifting buying and selling pressures between the two most popular currencies could cause temporary disruptions and the development of minor corrections.
The temporary depreciation of the euro can be attributed to two prime causes. Firstly, the rising number of COVID-19 cases in Europe is prompting renewed investors' fears concerning the potential reintroduction of stricter government restrictions in a bid to curtail a second coronavirus wave.
Secondly, the downbeat forecasts for France and Germany's August manufacturing and services PMI numbers, that are due for publication tomorrow, are putting extra pressure on the euro. In contrast, the consensus expectations for the US industry data, also scheduled for release tomorrow, are strengthening the reeling dollar.
Meanwhile, the status of the Japanese yen as a safe-haven asset continues to garner heightened investors and traders' interest due to the protracted uncertainty stemming from the coronavirus crisis.
All of these developments are likely to cause a minor retracement on the EURJPY pair in the short-term. As regards the longer-term, however, the overall sentiment continues to be prevailingly bullish.
The Elliott Wave Theory can be applied with great success under these volatile and transitionary market conditions, as it can outline the potential length and direction of current and future price waves. Consequently, traders can use these projections to determine the likely extent of the anticipated correction before the broader trend can resume developing.
1. Long-Term Outlook:
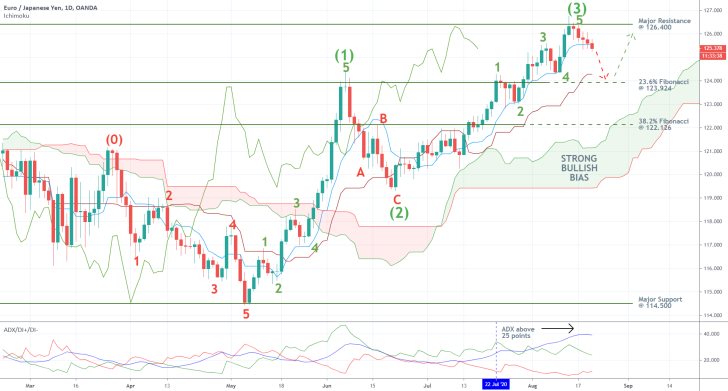
The daily chart of the EURJPY pair below demonstrates different EWT cycles, which underscores the fractal nature of the price action. As can be seen, after the pair established the first bullish 1-5 impulse wave pattern, which reached the 123.924 resistance, it went on to develop a corrective ABC pattern. Afterwards, the price action established another bullish 1-5 impulse wave pattern, which reached a new peak just below the major resistance level at 126.400.
The aforementioned fractal nature of the price action really becomes apparent once the initial 1-5 impulse wave pattern is perceived as the first impulse leg of a broader 1-5 pattern (part of a larger EWT supercycle). This initial impulse leg with a peak at (1) was subsequently followed by the first retracement leg (1)-(2), which is comprised of the aforementioned ABC correction. Next, the second impulse leg of the supercycle (2)-(3) is comprised of the aforementioned second 1-5 impulse wave pattern.
Based on all of this, it can be asserted that the market is due for a new dropdown, which would encompass the second retracement of the supercycle (3)-(4). It could drop as low as the 23.6 per cent Fibonacci retracement level at 123.924, which coincides with the peak of the initial impulse leg.

The Ichimoku Cloud indicator continues to highlight the ostensibly bullish bias of the market. This is a favourable condition for the development of the final impulse leg of the supercycle (4)-(5), once the retracement leg is concluded.
Meanwhile, the ADX indicator has been threading above the 25-point benchmark since the 22nd of July, which confirms the trending market environment. This reading of the indicator is completely inlined with the expectations for the continued appreciation of the price action in the long run after the anticipated correction is finally completed.
2. Short-Term Outlook:
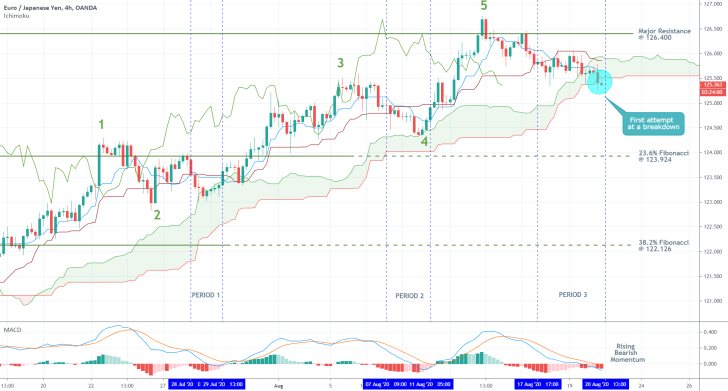
As can be seen on the 4H chart below, the underlying bearish momentum is rapidly rising, which is confirmed by the MACD indicator. Even more interestingly, the price action is about to break down below the Ichimoku cloud for the first time in a while. This is demonstrative of solid bearish pressures in the short run.
The first time the price action attempted to break down below the 26-day MA (in dark red), and the 9-day MA (in blue) was during period 1 when it promptly rebounded from the cloud. The second time was during period 2 when the price action managed to temporarily penetrate the cloud, which is serving the role of floating support, but then it rebounded once again. Period 3 marks the first time the price action is threading below the two MAs and the cloud itself, which is a significant indication of robust bearish pressure in the market.

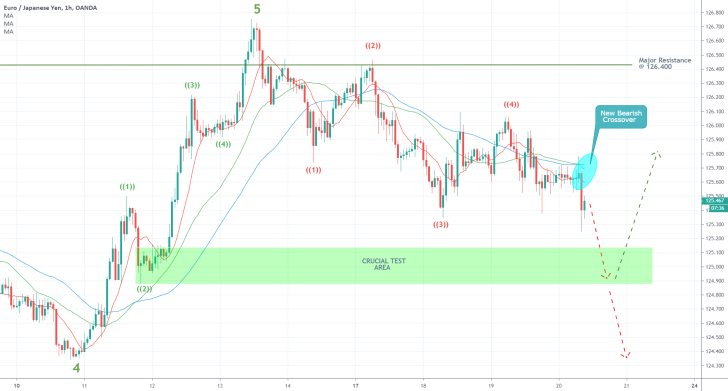
As regards the immediate short-term, the importance of the EWT is once again confirmed on the hourly chart below. A minor (bearish) 1-5 impulse wave pattern is currently developing, and the only thing that is left is for the final ((4))-((5)) impulse leg to be finalised. The price action could either fall to the Crucial Test Area (the green area) before it rebounds, or sink towards the bottom at point 4.
Notice that the price action is positioned below the 10-day MA (in red), which is trading below the 30-day MA (in green). The latter, in turn, has recently fallen below the 50-day MA (in blue). This descending order is exhibitive of the rising bearish sentiment at present.

3. Concluding Remarks:
Before placing their orders on the EURJPY pair, traders need to decide whether they prefer trading the short-term or the long-term. The former entails the likely establishment of a minor retracement leg of a broader 1-5 impulse wave pattern, whereas the latter favours the continuation of the prevailing rally's development.

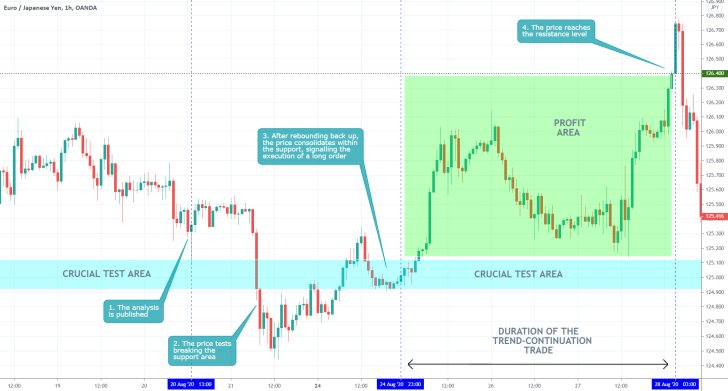
- Executing two trades that contain the same currency (Japanese Yen) back to back (the previous analysis studied the NZDJPY) is not recommended, because it increases the overall risk.
- The bearish pullback was not as sizable as anticipated by the analysis. Nevertheless, the price action did indeed rebound towards the resistance at 126.400.
Disclaimer: Your capital is at risk! Trading and investing on the financial markets carries a significant risk of loss. Each material, shown on this website, is provided for educational purposes only. A perfect, 100% accurate method of analysis does not exist. If you make a decision to trade or invest, based on the information from this website, you will be doing it at your own risk. Under no circumstances is Trendsharks responsible for any capital losses or damages you might suffer, while using the company’s products and services. For more information read our Terms & Conditions and Risk Disclaimer.


