The EURUSD has been climbing for the past several weeks, and there still seems to be spare bullish capacity for more gains remaining. The pair is nearing a major resistance level of historic importance that could turn out to be a major turning point. This is similar to what is currently being observed on the GBPUSD.
Even though such a major reversal could be just around the corner, the existing uptrend could still generate some notable gains before the buying sentiment is completely exhausted. Chiefly, the price action is yet to test that historic resistance level.
As regards the current fundamental factors that should be paid the closest attention to, this week's industry and employment data in the U.S. is likely to cause the most significant impact on the EURUSD. In particular, robust payrolls numbers on Friday could bolster the weakened dollar, thereby interjecting the currency pair with new selling pressure.
For the time being, however, market volatility remains relatively subdued, which is why bulls and bears alike should be cautious of potentially adverse fluctuations as the price comes close to the aforementioned barrier.
Eyeing the Current Stage of the Wyckoff Cycle
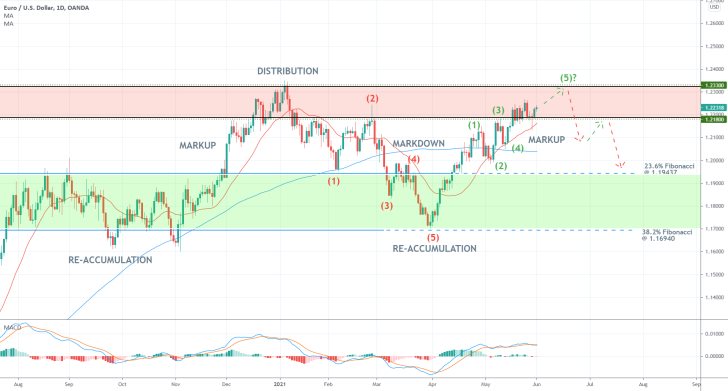
As can be seen on the daily chart below, the price action is currently drawing close to the upper boundary of the Distribution range at 1.23300. This is the aforementioned resistance level with historic importance that could tip the EURUSD in the opposite direction. This has already happened once during the development of the previous Markup.
The current Markup takes the form of a broad 1-5 impulse wave pattern, as postulated by the Elliott Wave Theory. Given that the final impulse leg (4-5) appears to be still in the making, the latest upswing is indeed likely to climb to the closest resistance - the one at 1.23300.
Several days ago, the price action momentarily fell below the lower limit of the Distribution range (at 1.21800), which was followed by a sharp rebound from the 20-day MA (in red). This resulted in the establishment of a Hammer candle, which entails strong bullish pressure. This recent behaviour of the price action represents yet another indication of the remaining bullish commitment in the market.
Once this bullish commitment, as currently underpinned by the MACD indicator, is exhausted, the EURUSD would then be ready to begin the development of a new Markdown. Such transitions typically involve heightened price fluctuations, which is something that market bears should keep in mind.
While bulls could try to take advantage of the remaining opportunity in the short term, bears would likely weigh in on the possibility for contrarian trading in the longer term. This would entail trading on a more sizable bearish reversal from the Distribution.
Before this could happen, however, the EURUSD would have to break down below the lower edge of the Distribution, which is currently converging with the 20-day MA, and then do the same with the 100-day MA (in blue). The next target with psychological importance for such a new Markdown is encapsulated by the upper boundary of the Re-Accumulation range. The latter is underpinned by the 23.6 per cent Fibonacci retracement level at 1.19437.
The Final Stages of the Ascending Wedge
The remaining potential for continued price appreciation in the short term that was mentioned above is underscored by the Ascending Wedge pattern on the 4H chart below. Wedges are structures that signify probable upcoming reversals, which is inlined with the broader expectations. However, the current consolidation of the price action near the lower limit of the Wedge illustrates the possibility for one final upswing towards its upper boundary.
If the price manages to penetrate above the previous two swing peaks - at 1.22340 and 1.22600, respectively - then it would be able to test the historic resistance at 1.23300, which is about to converge with the upper limit of the Wedge.
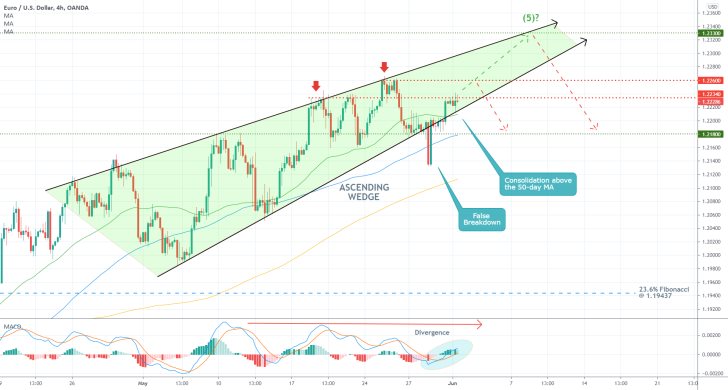
However, if the price action retraces from either of the two swing peaks and breaks down below the lower limit of the Wedge, this could open up the possibility for the emergence of a sizable correction in the short term. This is substantiated by the fact that the MACD is currently developing a massive divergence.
The lower boundary of the Distribution encapsulates the first target level for such a correction, at 1.21800. The latter is currently converging with the 100-day MA (in blue).
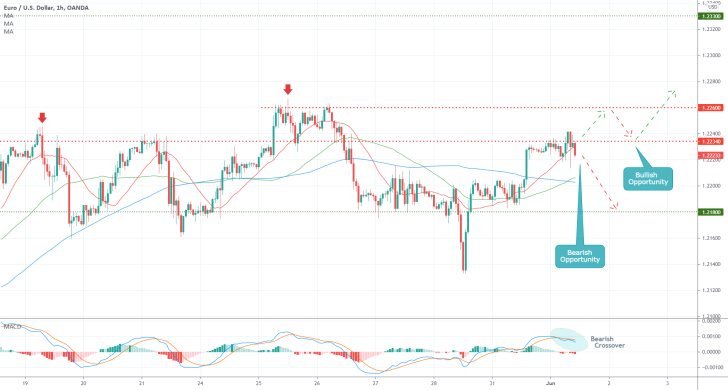
Rising bearish pressure in the short term can be observed more clearly on the hourly chart below. The MACD has already registered a bearish crossover, which could be a precursor to an immediate reversal, and the price action is consolidating below the minor resistance at 1.22340.
Depending on one's level of risk-aversion, both bulls and bears could try to utilise this trading opportunity in the short term.
Concluding Remarks:
Bears could try to sell at the current market price; however, they need to place very tight stop losses (just above the latest peak). As stated earlier, their first target level is underpinned by the lower boundary of the Distribution range. If the price action instead consolidates above 1.22340, bears should better wait for the price to reach the upper end of the Distribution (and Wedge) before they attempt to sell the EURUSD once again.
In contrast, a bullish entry would only be warranted if the price consolidates between the two swing peaks. Intuitively, the first target for bulls is represented by the resistance level at 1.22300. They should also place tight stop-loss levels, either below the 50-day MA (in green) or the 100-day MA at the time of trade execution.
EURUSD Consolidates Ahead of ECB's June Meeting
The euro is consolidating at present as all eyes turn to the highly anticipated ECB meeting, which is due tomorrow. Christine Lagarde and her colleagues at the Governing Council are expected to deliberate on the latest inflation and economic developments in the Euro Area.
The ECB is likely to maintain its asset purchases under the Pandemic Emergency Purchasing Programme (PEPP) at an accelerated pace owing to the fact that inflation does not yet constitute a major impediment to growth. This was substantiated by the fact that the trend of growing consumer prices globally has eased in May.
This would likely benefit the greenback in the short term, thereby bolstering EURUSD's current correction.
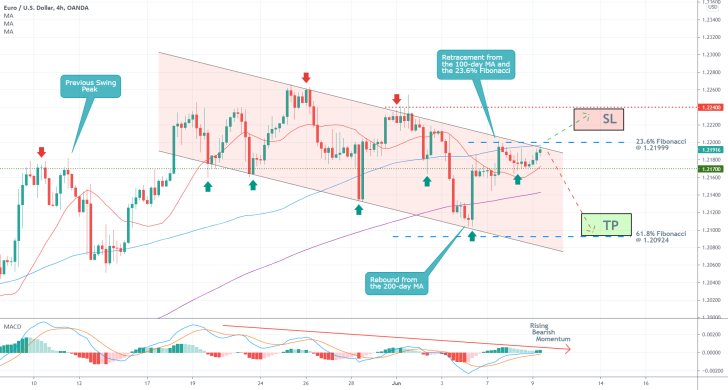
As can be seen on the 4H chart above, the EURUSD is currently establishing a major descending channel. The price has rebounded from the lower boundary of the channel on three occasions so far, while its reversals from the upper boundary are only two. Given that the price action is currently threading around it, an immediate retracement seems highly probable.
Notice that the price action is currently contained below the 23.6 per cent Fibonacci retracement level at 1.21999 (it has psychological significance), which converges with the upper boundary of the channel and the 100-day MA (in blue). The convergence of these three major thresholds confirms the expectations for a decisive reversal from the current market price.
The lower edge of the temporary consolidation range is underscored by the previous swing high (at 1.21700) and the 20-day MA (in red). If the price manages to break down below the two, the renewed downswing would likely head towards the 61.8 per cent Fibonacci retracement level at 1.20924 next.
Bears looking to sell the EURUSD spot should consider placing a tight stop-loss order just above the last swing peak at 1.22400. They should also watch for sudden rebounds from the 200-day MA (in purple), which serves the role of a floating support. The price established such a sharp rebound from the moving average the last time it tested it.
Finally, the MACD indicator illustrates steadily growing bearish momentum in the short term, which is inlined with the primary expectations of this follow-up analysis.
Temporary Break in EURUSD's Descend
Today's somewhat diminished liquidity in the market, owing to the lack of any major events in the economic calendar, led to a temporary strengthening for the EURUSD. Even still, the prevailing market sentiment remains ostensibly bearish.
The euro did not manage to gain any significant headway in the wake of the ECB meeting last week, while the greenback looks poised to strengthen over the next several days.
FED's upcoming meeting is unlikely to lead to policy tightening, which, given the current circumstances, would probably support the recuperating U.S. dollar. Hence, once the momentary correction peaks, bears would have enough incentives to consider selling the EURUSD in anticipation of sustained price depreciation.
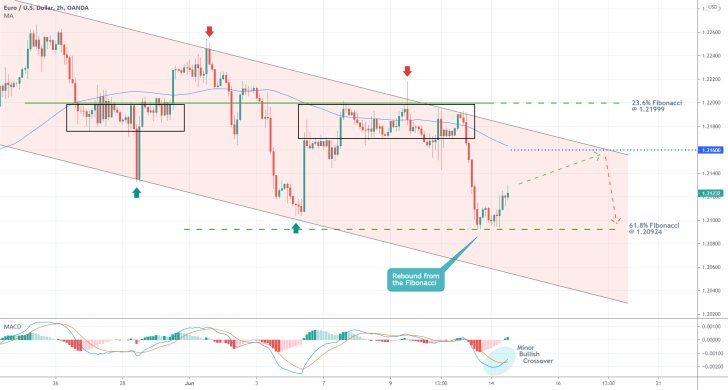
As can be seen on the 4H chart above, today's correction was initiated from the psychologically significant support level at the 61.8 per cent Fibonacci retracement. This is the final such threshold from the three Fibonacci retracements, which is why the price may need some time before it manages to break down below it decisively.
The rebound is not at all that surprising, given that it occurred from the previous swing low. This is underpinned by the minor bullish crossover on the MACD indicator.
It could be extended as high as the upper boundary of the descending channel before the price reverses yet again. Notice that this could happen from the 1.21600 minor resistance level, which is currently underscored by the 100-day MA (in blue).
The convergence of these two factors in addition to the fact that this level is also on the same plane as the two preceding consolidation ranges (the two rectangles), means that the price is likely to find very strong resistance there. All of this presupposes a very probable reversal from 1.21600 and the continuation of the downtrend below the 61.8 per cent Fibonacci retracement level at 1.20924.
The major support level at 1.19437 (look at the initial analysis) would remain the next target for the renewed downtrend.
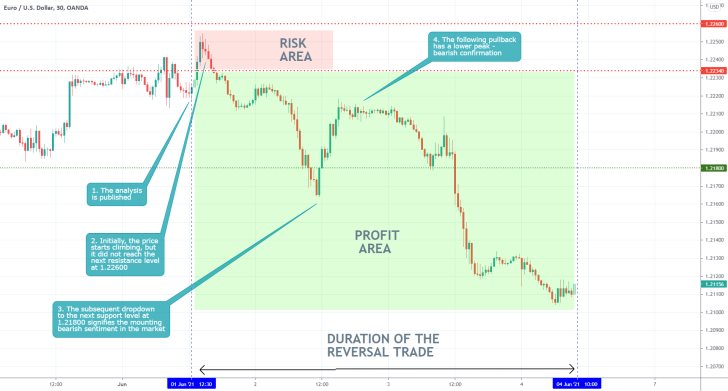
- The bearish reversal on the EURUSD occurred exactly as expected by the projections of our last analysis of the pair. The price started falling shortly after its publication.
- The bearish trade continues to develop, and traders should keep an eye on the non-farm payrolls data in the U.S., which is scheduled for release later today.
- The employment numbers, depending on whether they meet or fall short of the initial market forecasts, could send the price of the EURUSD in either direction.
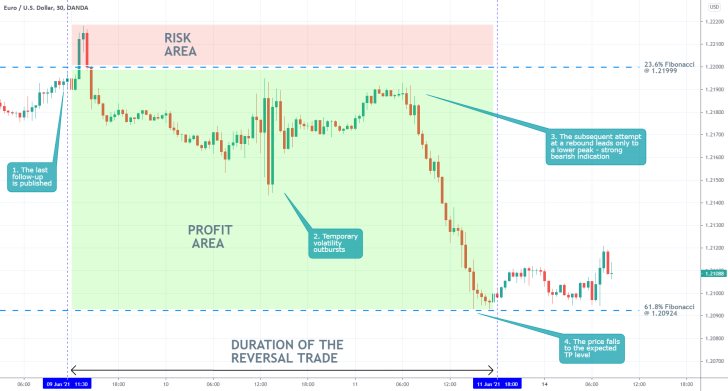
- The price of the EURUSD behaved exactly as expected. Shortly after the publication of the last follow-up analysis, it rebounded from the upper boundary of the channel (and the 23.6% Fibonacci retracement level) and sunk to the next psychological target - the 61.8% Fibonacci retracement level at 1.20924.
- This is a good example of why the best trades are executed when there is a confluence of indicators - all pointing in the same direction.
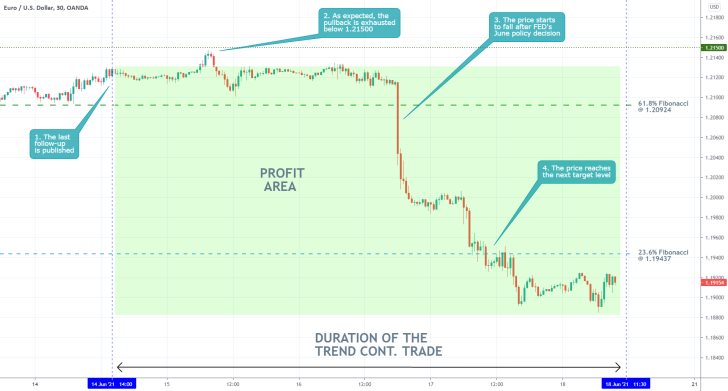
- The last follow-up analysis of the EURUSD successfully projected a minor bullish pullback followed by a massive downturn to the 23.6 per cent Fibonacci retracement level at 1.19437.
- It was FED's June meeting that catalysed the beginning of a new downtrend, as the FOMC adopted a more hawkish policy stance.
Disclaimer: Your capital is at risk! Trading and investing on the financial markets carries a significant risk of loss. Each material, shown on this website, is provided for educational purposes only. A perfect, 100% accurate method of analysis does not exist. If you make a decision to trade or invest, based on the information from this website, you will be doing it at your own risk. Under no circumstances is Trendsharks responsible for any capital losses or damages you might suffer, while using the company’s products and services. For more information read our Terms & Conditions and Risk Disclaimer.


