The past several days have been especially intriguing, given the market's reactions to the AstraZeneca vaccine news and the latest developments in Washington. Gold tumbled yesterday as mounting, promising evidence underpins the development of a viable vaccine against the coronavirus. This market reaction demonstrates the sudden decrease in global demand for safe-haven assets and other low-risk securities.
Overall uncertainty continued to falter today, as Donald Trump started to relent on the Presidential transitionary process. He allowed President-Elect Joe Biden and his team access to the White House, and various administrative procedures and agencies. Even though Trump continues to refuse to concede, the market interpreted today's developments as representing another step further towards the successful transition of power.
The persisting risks to growth are thus tilted to the downside, as far as the general market is concerned, which is likely to support the US dollar finally. The greenback has gone through a difficult patch, as the last scramble for low-risk securities drove the demand for the world's most popular currency down. Nevertheless, the tide of the aggregate supply and demand dynamics seems to be shifting, which could lead to another reversal for the EURUSD.
1. Long-Term Outlook:
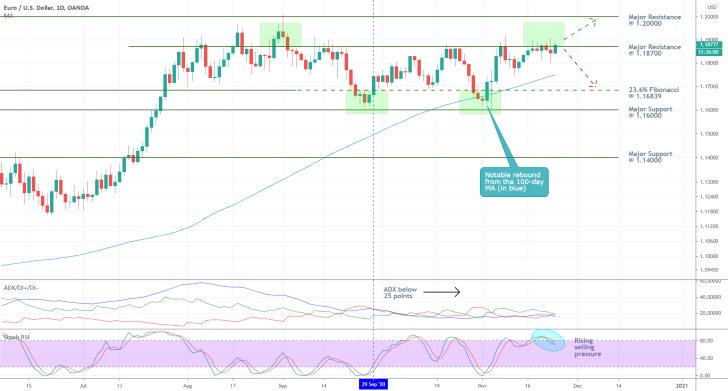
As can be seen on the daily chart below, the pair remains concentrated within the boundaries of a clearly visible range, which spans between the major resistance level at 1.18700 and the 23.6 per cent Fibonacci retracement level at 1.16839. Given that the price action has consolidated around the upper border of the range for seven consecutive days, a new bearish correction seems more likely with every passing day. The aforementioned fundamentals could trigger such a rebound.
The ADX indicator has been threading below the 25-point benchmark since the 29th of September, which confirms the robustness of the range-trading environment. Such market conditions substantiate expectations for sudden price reversals from either of the underlying range's extremes. Moreover, the Stochastic RSI indicator is just now starting to exit out of its 'Overbought' extreme, which demonstrates that more and more traders weigh in on such a reversal.
If the price action does indeed start to depreciate, its next target level would be the lower limit of the range – the 23.6 per cent Fibonacci. Before the price action can reach it, however, it would have to break down below the 100-day MA (in blue), which is serving the role of a floating support. As can be seen, the price action already rebounded from the moving average the last time the pair reached it, which was when the MA converged with the Fibonacci support. Therefore, the market bears should be especially observant the next time the price action tests the 100-day MA.
Conversely, if the underlying market sentiment were to change unexpectedly (similarly to what happened with gold yesterday) and the price action manages to break out above the major resistance at 1.18700 decidedly, then the next target for the renewed bullish momentum would be the major resistance level at 1.20000. The latter bears significant psychological importance – it was reached only once since April 2018, and the price rebounded almost immediately afterwards.
2. Short-Term Outlook:
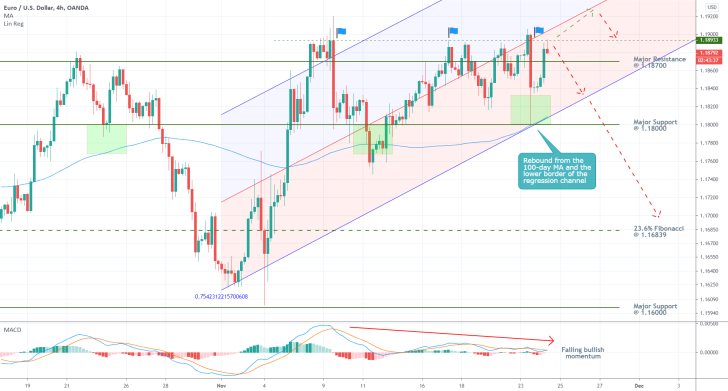
The behaviour of EURUSD's price action in the short-term is even more demonstrative of a likely bearish reversal. As can be seen from the 4H chart below, the pair has already tested the resistance at 1.18933 on three separate occasions (the three flags). All of them turned out to be failed attempts at a breakout, which further supports the expectations for another reversal.
Notice also that a regression channel tool is applied to the latest upswing. The price action has consolidated around its middle line for quite a while now, and another rebound towards the channel's lower edge seems highly probable. This is confirmed by the fact that the underlying market momentum has been consistently falling since the price action established the peak of the latest upswing.
Before the price action can start depreciating towards the channel's lower boundary, however, it would have to penetrate below the psychologically significant support level at 1.18000. Notice also that the last time the price action reached this level, it rebounded. Moreover, it rebounded by leaving a massive lower shadow on the corresponding candle, which also tested the lower edge of the regression channel and the 100-day MA. In other words, the expected downturn could potentially be temporarily suspended around 1.18000.
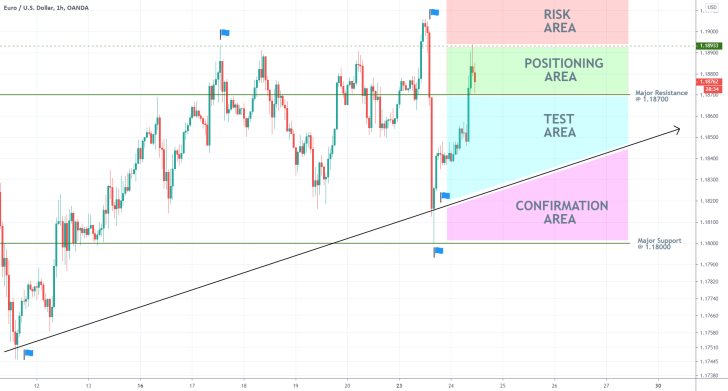
Given the underlying range-trading sentiment, market bears can use contrarian trading strategies to utilise the current setup. As can be seen on the hourly chart below, there are several areas of key interest. Less risk-averse traders can look for entry opportunities within the 'Positioning Area', whereas more risk-averse traders could wait for a breakdown within the 'Test Area'.
The 'Risk Area' underscores the threat of more adverse fluctuations and false breakouts above 1.18933, while the ascending trend line demonstrates the likely levels where the new downtrend could experience temporary disruptions.
Once the price action manages to penetrate the 'Confirmation Area', the strength of the underlying bearish pressure would be confirmed. Hence, bears with open positions can look for opportunities to add to them, whereas other traders could look for opportunities to apply trend-continuation strategies, on the condition that the price action establishes a minor bullish correction. The primary target level remains the 23.6 per cent Fibonacci retracement at 1.16839.
3. Concluding Remarks:
While the underlying setup looks fairly solid, in that the price action seems poised to head towards the lower end of the aforementioned range, traders should be cautious when placing orders. As was seen yesterday with the price of gold, sudden ripples could invalidate the underlying ranging conditions. Hence, traders are better-off using narrow stop-loss orders.
The EURUSD Is Getting Ahead of Itself
The EURUSD demonstrated increasingly strengthening bullish commitment following the publication of our last analysis of the pair, despite the strong indications to the contrary that were observed then. The price broke out above the psychologically significant resistance at 1.20000, and instead of reverting itself there, it climbed further to the current market price of 1.21000.
The upsurge was prompted by heightened vaccine optimism, but things are quickly changing for the worse. The market is currently being driven by the so-called 'Animal Spirits', a term coined by the prominent economist John Maynard Keynes. Essentially, traders' hopes that a COVID-19 vaccine can be a game-changer in the fight against the pandemic, by allowing the global economic activity to be reinstated virtually overnight, is factually unfounded and unreasonable.
The divergence between such hopes and the underlying economic reality is becoming increasingly inflated, which poses a significant risk of a future burst. The dollar is weakening as traders weigh in on a swift normalisation of the global economic system, but there are no reasons to expect such a robust recovery so soon.
Major central banks have indeed observed faster-than-expected recuperation, but caution against the likely uneven nature of the future recovery process. An example of this is the roiled US manufacturing coupled with deteriorating consumer sentiment. The situation is similar in Europe, as German consumer confidence retreated in November as well.
Given these and other factors that underpin the prevailing uncertainty of recovery, it seems a matter of time before the market sobers up and realises that its general excitement is getting ahead of the actual economic performance. This is likely to cause at least a partial correction for the EURUSD, as well as other assets. A probable catalyst for such a correction could be the US unemployment data that is scheduled for publication tomorrow. The consensus forecasts anticipate another robust NFP report, which could finally tip the greenback in the opposite direction.
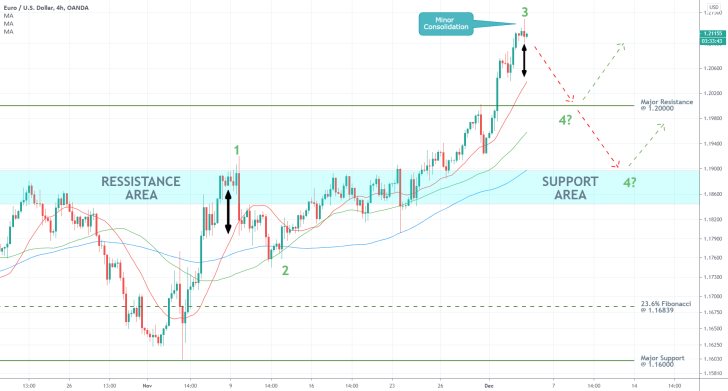
As can be seen on the 4H chart above, the price action is currently consolidating within a very narrow range around 1.21300. One of the biggest reasons to expect a bearish correction, at least to the major resistance (currently support) level at 1.20000, stems from the fact that the price action is surging way above the 20-day MA (in red). The last time the price action was outpacing this fast-moving MA, it established the peak at point 1 (also the Resistance Area, which is currently serving as a Support).
Speaking of moving averages, the price action currently follows a Perfect Ascending Order with the three underlying MAs – the price, as was already established, is trading above the 20-day MA, which is positioned above the 50-day MA (in green), which, in turn, is placed above the 100-day MA (in blue). If not to the 1.20000 support, then a bigger bearish correction could sink as low as the 100-day MA before the selling pressure is checked.
The price action appears to be forming a major 1-5 impulse wave pattern (bullish). Given that it is currently in the process of developing the second impulse leg (2-3), a subsequent retracement leg (3-4) would realise the primary expectations for a bearish correction.
A Day of Reckoning for the EURUSD
The highly anticipated meeting of ECB's Governing Council yesterday did not disappoint. The Central Bank expectedly increased the envelope of its Pandemic Emergency Purchasing Programme (PEPP) by an additional 500 billion euros, thereby adopting an even more accommodative monetary policy stance.
Many traders were expecting to see the euro rising in the wake of such a decision, as the currency haд always responded positively to heightened liquidity levels since the beginning of the crisis. What they failed to account for, however, was the fact that the market had already priced in such a move by the ECB. In fact, it was pretty obvious that the December meeting would be significant ever since the Council's previous meeting in late-October, when they refrained from making any interventions whatsoever.
So, the pair did rise in the several hours after the decision was made public, but only marginally. Moreover, the EURUSD failed to establish a higher swing peak, which further increases the likelihood of a trend reversal. That is why today's follow-up examines the prospects for such a course of action.
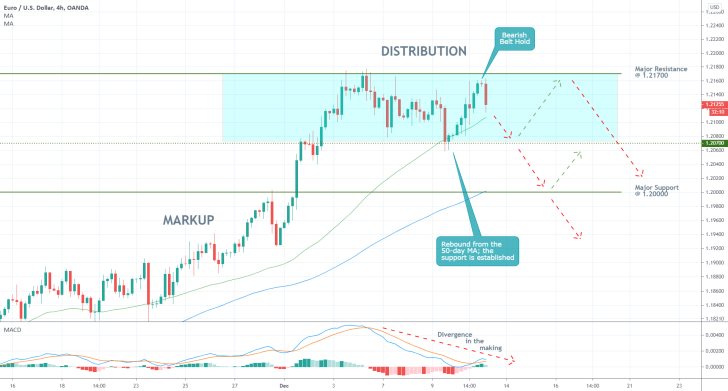
As can be seen on the 4H chart above, the previous Markup is now slowly losing steam, as it transitions into a new Distribution range. Utilising the Wyckoff Cycle theory, it can be asserted that a further Markdown is likely to emerge from this intermediate range.
The Distribution range itself spans between the major resistance level at 1.21700 and the minor support level at 1.20700. Notice that the size of the entire range equals exactly 100 pips, which is of psychological significance. Moreover, the lower boundary of the range was established after the price action rebounded from the 50-day MA (in green), which is why traders need to keep monitoring the behaviour of the price action around this moving average. A decisive breakdown below the 50-day MA and the 1.20700 support would be required to confirm the beginning of a new Markdown.
Notice also that the price action has established two swing highs just below the major resistance at 1.21700, but has failed to break out higher. Seeing as how the ECB news from yesterday was anticipated by many to drive the price action further north but didn`t, this can be interpreted as an early sign of a forthcoming trend reversal.
When the two swing highs are examined using the MACD indicator, it becomes evident that the underlying bullish momentum is waning down. This implies the development of a new Divergence, which would favour the establishment of such a trend reversal.
Market bears should not rush to place selling orders right away because the underlying bullish sentiment is still far from being completely invalidated. Nevertheless, they should continue monitoring the behaviour of the price action while it remains concentrated within the Distribution range. It seems more likely that the EURUSD would continue consolidating in the near future before it attempts a more decisive breakdown.
Such a development would indeed signify the beginning of a new Markdown; however, contrarian traders should be cautious of the psychologically significant support level at 1.20000. The latter serves the role of a prominent turning point, which could result in the termination of such a Markdown early on.
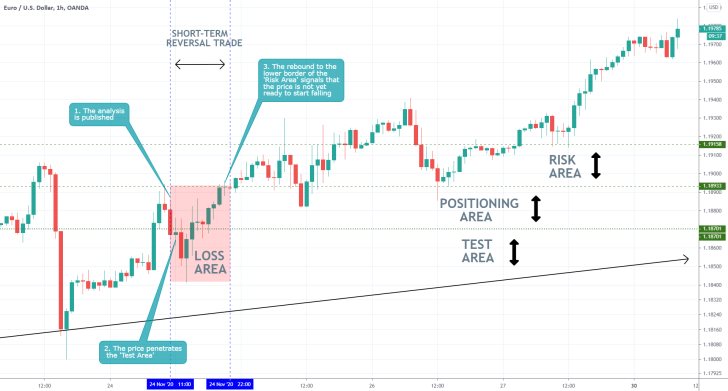
- Shortly after the release of the analysis, the price penetrated within the 'Test Area', which signalled that the market might be ready to reverse. The quick rebound to the lower boundary of the 'Risk Area' afterwards invalidated these expectations.
- The biggest fault of the analysis was overestimating the magnitude of the temporary bullish momentum around the time of its release. Nevertheless, it had excellent zoning representation of the different types of areas, which prevented further losses. Moreover, the analysis' cautioning against the risks associated with contrarian trading would have prevented most risk-averse traders from executing any short orders.
- The next follow-up will examine the potential trading opportunities around the massively important psychological resistance at the 1.20000 level.
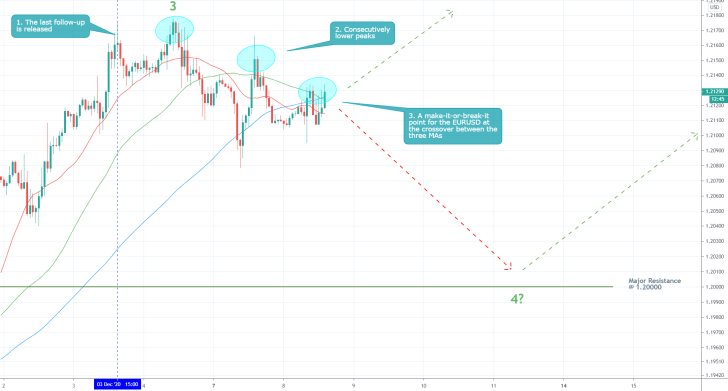
- The EURUSD is behaving as per the expectations of the last follow-up in that the price action has started correcting itself from the peak at point 3. Nevertheless, the price action is currently testing the convergence of the three moving averages – the 100-day MA (in blue); the 50-day MA (in green); and the 20-day MA (in red). A bearish rebound from the three MAs would clear the way for the price action to resume falling towards the major resistance (currently support) level at 1.20000, whereas a decisive breakout in the immediate future would indicate reinstated bullish commitment.
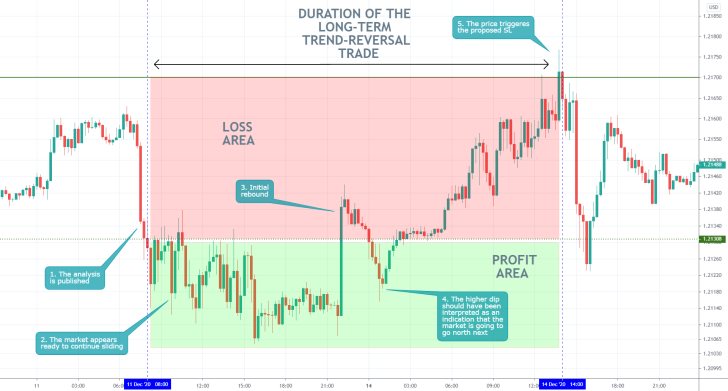
- The price action initially behaved as per the projections of the last follow-up; however, the market promptly changed directions. It was a good thing that it was argued in the follow-up analysis that such a reversal is possible, which capped the potential losses.
Disclaimer: Your capital is at risk! Trading and investing on the financial markets carries a significant risk of loss. Each material, shown on this website, is provided for educational purposes only. A perfect, 100% accurate method of analysis does not exist. If you make a decision to trade or invest, based on the information from this website, you will be doing it at your own risk. Under no circumstances is Trendsharks responsible for any capital losses or damages you might suffer, while using the company’s products and services. For more information read our Terms & Conditions and Risk Disclaimer.


