The EURUSD failed to break out above the historic resistance level at 1.23000, which was the primary focus of our previous analysis of the pair, thereby, effectively concluding the preceding bullish trend. In that regard, the underlying trading setup remains the same - take advantage of the subsequent trend reversal into bearish territory.
There are plenty of fundamental factors that can contribute to the strengthening of the dollar starting this week and all of them are interconnected. Firstly, the recent uptick in headline inflation represents a step closer towards achieving FED's inflationary goals, which is a sign of economic stabilisation.
As a result of this upsurge in consumer prices, the FOMC (scheduled to meet this Wednesday) seems less likely to adopt an even more dovish monetary policy stance at the present rate by scaling up its quantitative easing policies. In other words, FED's envelope of net purchases is likely to remain virtually unchanged in January. Consequently, the historically low U.S. yields will not become even more damaging to the value of the greenback.
Meanwhile, President Joe Biden's comprehensive fiscal plan looks promising enough to finally match the Government's fiscal policy's scope to the Federal Reserve's substantial monetary policy, thereby making the two function in conjunction with each other.
All of these contributing factors are likely to prompt the FOMC to adopt slightly more hawkish rhetoric on Wednesday. However, it should be stressed that it is way too early to be talking of any transformational changes of direction for the Federal Reserve. Even still, the stars seem to be finally aligning for the greenback, and the EURUSD thus looks poised to resume depreciating in the near future.
1. Long-Term Outlook:
After the completion of the false breakout above the historic resistance, as shown on the daily chart below, the price action went on to develop a new downswing. At present, the pair is in the process of establishing a minor bullish pullback before likely resuming to fall after a new peak is reached.
These assertions are backed up by the fact that last Friday's trading session led to the emergence of a Doji candlestick, which is commonly found at the end of such pullbacks. The 23.6 per cent Fibonacci retracement level at 1.19429 continues to represent the first major target for the newly emerging downtrend, though another intermittent test of the historic resistance beforehand is not entirely implausible.
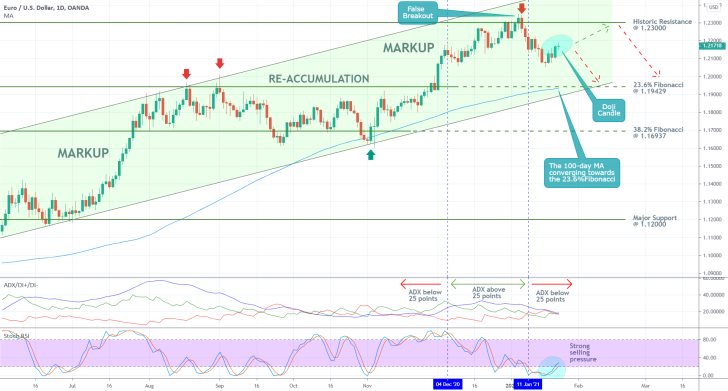
There are many reasons to expect a dropdown to the psychologically significant support at the 23.6 per cent Fibonacci. Firstly, it previously served as an upper boundary of the intermediate Re-Accumulation range (as indicated by the two red arrows). Hence, its new role as a major support is due to be tested. Secondly, the lower edge of the ascending channel (in light green), as well as the 100-day MA (in blue), are both currently converging towards the 23.6 per cent Fibonacci, which makes it an even more prominent support level.
Notice that the ADX indicator has been threading below the 25-point benchmark since the 11th of January, which means that technically the market is currently range-trading. Such market environments are suitable for the development of trend reversals - a new downswing in this case.
Finally, the Stochastic RSI indicator underlines the existence of massive selling pressure at present. Even though it is currently at its 'Overbought' extreme, and this could prompt a temporary upsurge of buying pressure, the prevailing selling pressure is likely to continue driving the price action lower.
2. Short-Term Outlook:
At present, the price action is contained within the 23.6 per cent Fibonacci extension level at 1.21698 and the 38.2 per cent Fibonacci extension level at 1.20614, as shown on the 4H chart below. These extension levels are drawn in relation to the last bullish upswing (not the entire uptrend against which the primary Fibonacci retracement levels are drawn) and therefore show potential entry levels for a selling position.
Notice also that the current downswing (that emerged after the failed breakout above 1.23000) represents a 1-5 impulse wave pattern, as postulated by the Elliott Wave Theory. Given that the 3-4 retracement leg appears completed below the 100-day MA and the 23.6 per cent Fib. Ext., the final 4-5 impulse leg now seems like the most plausible outcome.
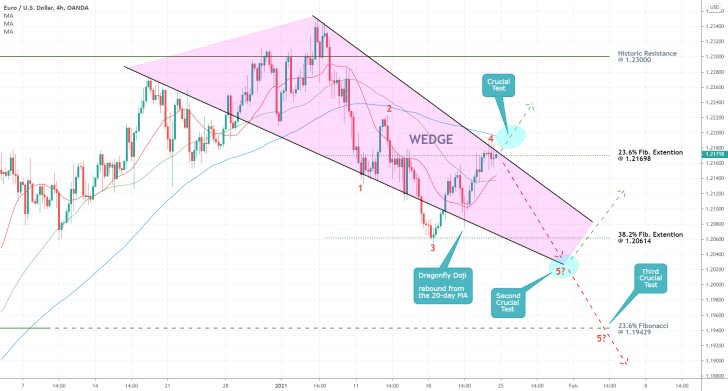
Traders need to carefully observe the behaviour of the price action around the latest swing high. If it breaks out above the 100-day MA, this would indicate that the market is not yet ready to start falling. However, even if the final 4-5 impulse leg is established next, a bullish rebound from the "Second Crucial Test" would indicate the potential development of an Ascending Wedge pattern. In other words, bears who have sold near the peak at 4 need to be cautious of potential rebounds from the lower end of the Wedge pattern.
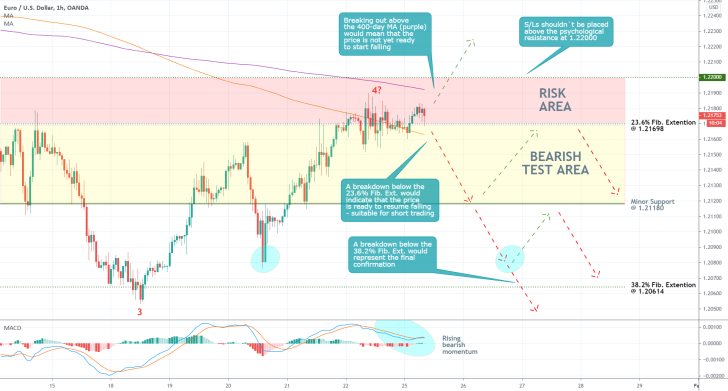
As can be seen on the hourly chart below, the Risk Area, spanning between the 23.6 per cent Fib. Ext. and the psychological resistance at 1.22000, underpins the risk for bears choosing to place short orders around the peak at 4.
Meanwhile, the Bearish Test Area encompasses the zone in which the price action is likely to fluctuate more before the bearish sentiment is confirmed. This would happen once the price breaks down below the minor support at 1.21180, and then below the 38.2 per cent Fib. Ext.
Seeing as how the underlying momentum is becoming more ostensibly bearish, as demonstrated by the MACD indicator, another bearish probing in the near future seems highly probable.
3. Concluding Remarks:
Most underlying indicators seem to point to a likely continuation of the recent downswing. Market bears can look for an opportunity to enter short around the current market price; however, they should keep in mind that adverse fluctuations can reach as far as the upper boundary of the Risk Area. Any breakouts above it would mean that the price action is not yet ready to resume falling.
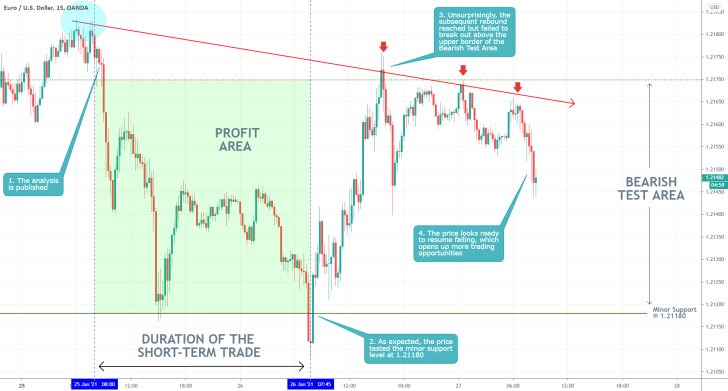
- Shortly after the publication of the initial analysis, the price action fell to the minor support level at 1.21180, as expected. Afterwards, a bullish pullback developed towards the upper boundary of the Bearish Test Area, which was also anticipated in the analysis. Notice that the price action failed to break out above the descending trend line (in red), which signals that it is ready to resume falling once again.
- Traders can use this as an opportunity for trend-continuation trading; however, they should keep in mind that the underlying risk area remains the same as was underpinned by the analysis.
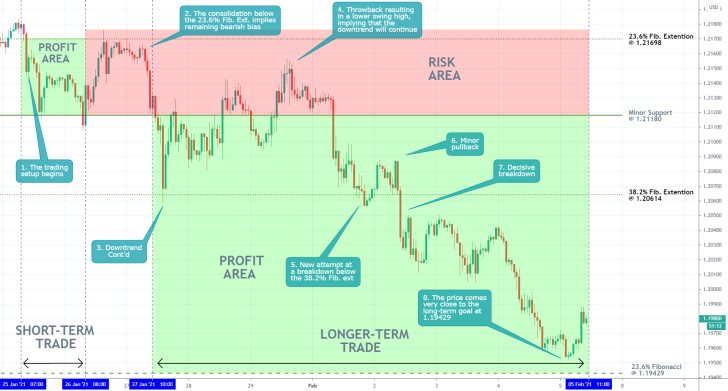
- The forecasts of the analysis turned out to be quite accurate, with the EURUSD expected to reach the target-level at the 23.6% Fibonacci retracement very soon. Both the technical and fundamental segments of the analysis were very precise, which allowed for excellent utilisation of the underlying trading setup.
Disclaimer: Your capital is at risk! Trading and investing on the financial markets carries a significant risk of loss. Each material, shown on this website, is provided for educational purposes only. A perfect, 100% accurate method of analysis does not exist. If you make a decision to trade or invest, based on the information from this website, you will be doing it at your own risk. Under no circumstances is Trendsharks responsible for any capital losses or damages you might suffer, while using the company’s products and services. For more information read our Terms & Conditions and Risk Disclaimer.


