The recent downtrend on the EURUSD pair appears to have already bottomed out, as the greenback's rally is temporarily put on a halt. Given this waning bearish sentiment, the underlying setup looks suitable for the implementation of contrarian trading strategies at the new dip.
Several crucial factors contribute to the depreciation of the greenback in the short term, the most significant one being the Omicron scare that plagues the stock market at present. The second contributing factor is the new monetary policy stance of the FOMC, adopted in light of soaring consumer prices and headline inflation topping a three-decade high.
According to FED Chair Jerome Powell's recent testimony, the Federal Reserve no longer views the current inflation pressures as being "transitionary", owing to the persistent supply and demand imbalances globally. This is significant because the likelihood of a rate hike in 2022 now seems much more substantial.
In short, Jerome Powell's testimony before the U.S. Senate signifies FED's increasingly more pronounced hawkish stance. Once the central bank tapers its purchases, the amount of liquidity circulating the economy would be diminished. Consequently, the international demand for U.S. stocks is likely to wane, thereby affecting the demand for the dollar as well.
The market has already started to price in these anticipated transformational changes, which is why the EURUSD is poised for a trend reversal. However, bulls should take advantage of this setup carefully, as these pressures are likely to unfold over the medium term. In other words, traders need to be prepared for lots of adverse fluctuations in the short term as the market changes its direction.
The Most Significant Bullish Indication
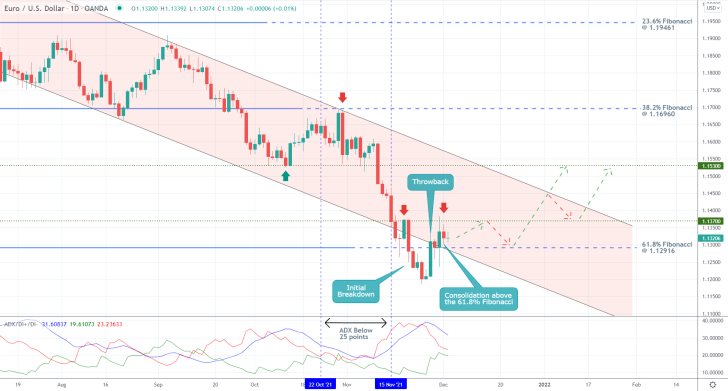
As can be seen on the daily chart above, the price action returned within the boundaries of the descending channel (in red) over the last several days. This happens following a false breakdown below the 61.8 per cent Fibonacci retracement level - the last Fibonacci threshold - at 1.12916. This is significant because any potential consolidation of the price action above this psychologically significant barrier would increase the likelihood of a trend reversal.
These assertions are substantiated by observing the behaviour of the price action around the 61.8 per cent Fibonacci. The initial breakdown (false) was followed by a throwback. The second attempt at a breakdown did not amount to anything either, since the candle with the long lower shadow closed above 1.12916. That is why the consolidation of the price action above the 61.8 per cent Fibonacci and the lower limit of the channel corroborates the expectations for a trend reversal.
The ADX indicator is currently threading above the 25-point benchmark, signifying that the market is still technically trending. That is why bulls should not rush to place their reversal positions just about anywhere. They should consider the probable emergence of a new consolidation range near the dip of the preceding downtrend carefully.
Such a consolidation range is likely to span between the 61.8 per cent Fibonacci and the minor resistance level at 1.13700, where adverse fluctuations are likely to occur over the following days and weeks. If the price action manages to break out above the latter decisively, the new downtrend would then head towards the previous swing low at 1.15300.
Before it could reach there, however, the price action would have to penetrate above the upper limit of the descending channel, which serves as a major resistance itself.
The Quiet Before the Storm
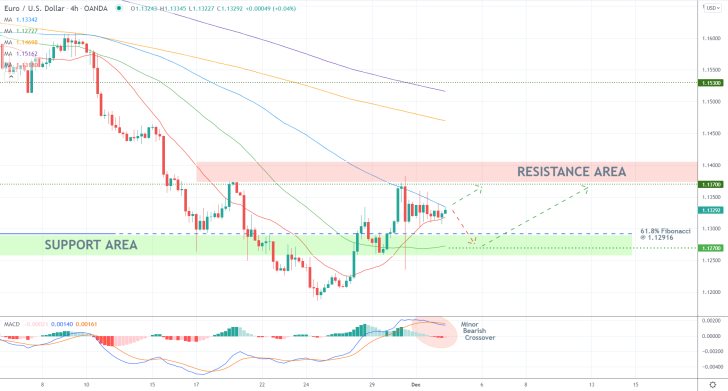
The temporary consolidation is represented in even greater detail on the 4H chart above. Pay especially close attention to the very narrow bottleneck that is currently emerging between the 100-day MA (in blue) and the 20-day MA (in red). This subdued price action is very likely to be followed by another sizable price swing in the near future.
The 12-day EMA (blue) on the MACD recently crossed below the 26-day EMA (orange), registering a minor bearish crossover. The histogram of the indicator also recorded this marginal uptick in bearish momentum, which could be a precursor to another dropdown towards the 61.8 per cent Fibonacci. This represents yet another reason why bulls should be extra cautious when going long, especially below the 100-day MA.
The 50-day MA (in green) underpins the major support level at 1.12700. This is where any adverse fluctuations below the 61.8 per cent Fibonacci are likely to be terminated.
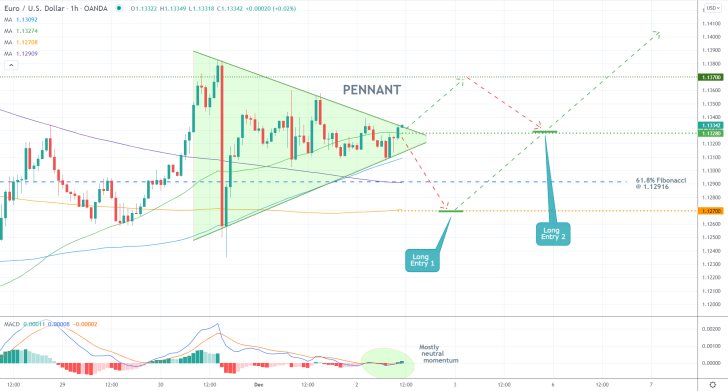
The consolidation is taking the form of a clearly defined Pennant pattern, as shown on the hourly chart below. Since such a figure develops near the dip of a recent downtrend, its emergence there corroborates the expectations for a bullish trend reversal.
The 200-day MA (in orange) converges with the above-mentioned 1.12700 level, making it an even more prominent support. The same applies to the 61.8 per cent Fibonacci, which is currently converging with the 300-day MA (in purple). Meanwhile, the 50-day MA (in green) indicates a minor resistance level at 1.13280, coinciding with the bottleneck of the Pennant.
The currently neutral market momentum, as underscored by the histogram of the MACD indicator, is something that needs to be taken into careful consideration as well.
Concluding Remarks
Depending on their level of risk-aversion, bulls can trade this setup in one of two ways. One way would be to place long limit orders between the 1.12700 support level and the 61.8 per cent Fibonacci. Alternatively, they can wait for a pullback from the 1.13700 resistance to 1.13280, where they can place long market orders. At any rate, their supporting stop-loss orders should not exceed 40 pips.
Once the price action breaks out above 1.13700, bulls would be able to substitute their fixed stop orders for floating TPs. That way, they would be able to gain the maximum out of the breakout further up north while also protecting themselves against sudden dropdowns.
When to Join EURUSD's Bullish Rebound
The price action of EURUSD appears to be developing a new uptrend following the completion of the preceding downtrend, as was pointed out by the initial analysis of the pair. This transition is characterised by heightened fluctuations in both directions, as the underlying bearish sentiment gives way to the mounting bullish pressure.
Even though this adverse volatility epitomises the uncertainty that currently prevails on the market, bulls may still be able to implement contrarian trading strategies in anticipation of the development of a new uptrend.
The euro is currently strengthening despite the somewhat disappointing economic sentiment numbers in Germany that were published recently. Meanwhile, bearish bias on the greenback continues to increase ahead of the end of the year. This trend is bolstered by the contracting global demand, and ahead of the release of the November CPI numbers in the U.S.
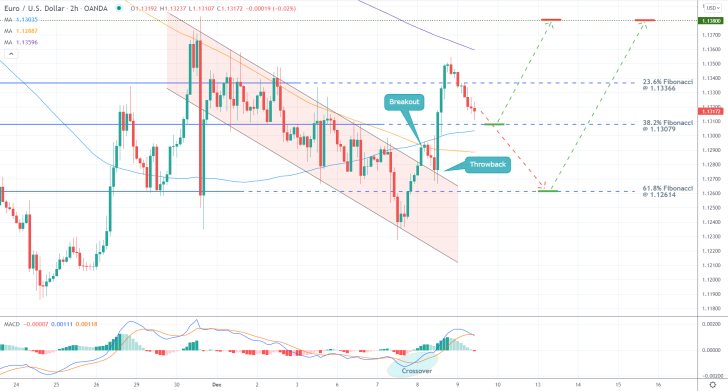
As can be seen on the 2H chart above, the underlying bullish pressure on the EURUSD started accumulating once again after the breakout above the descending channel. Notably, this occurred from the 61.8 per cent Fibonacci retracement level at 1.12614. This upsurge in bullish momentum was registered by the MACD indicator, corroborating the primary expectations.
Following the recently observed false breakout above the 23.6 per cent Fibonacci at 1.13366, the price action pulled back to the 38.2 per cent Fibonacci at 1.13079. This is where bulls can start looking for an opportunity to go long. The strength of the 38.2 per cent Fibonacci as a major support level is further elucidated by the fact that it is currently converging with the 100-day MA (in blue).
Hence, bulls can either go long around 1.13079 or at 1.12614. In either case, their supporting stop-loss orders should not be placed deeper than 30 pips below their initial entries.
The first target for the new uptrend is represented by the previous swing peak at 1.13800. However, bulls should keep in mind that the 300-day MA (in purple) serves as a floating resistance and could therefore prompt a reversal once the price action reaches it.
That is why bulls can consider substituting their fixed stop orders for floating TPs once the price action draws near to the 300-day MA.
More Chances to Join EURUSD's Bullish Reversal
Because of the recent selloff of the U.S. dollar, the EURUSD pair is currently in the process of establishing a bullish rebound. This would allow bulls to implement contrarian trading strategies in the expectation for the development of a new uptrend.
The change in the underlying buying and selling pressures was initiated yesterday following FED's December meeting. This process was further bolstered today following ECB's own meeting. The dollar is likely to continue losing ground against the single currency by the end of the year, given the anticipated impact of the market seasonality factor at this time of the year.
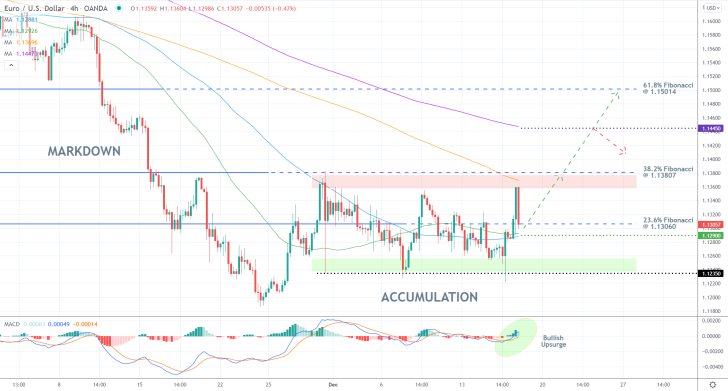
As can be seen on the 4H chart above, ECB's policy decision from earlier today prompted the third test (failed so far) of the Accumulation range's upper limit at the 38.2 per cent Fibonacci retracement level at 1.13807. The latter is currently converging with the 200-day MA (in orange), making it a more significant threshold.
Nevertheless, the MACD indicator picked up a resurgence of bullish momentum, underscored by the crossing of the 12-day EMA (blue) above the 26-day EMA (orange). This signifies the likely continuation of the uptrend further up north.
Notice that the price action is presently consolidating just above the 23.6 per cent Fibonacci retracement level at 1.13060, which is where bulls can execute long orders. Alternatively, they can go long at the major support level at 1.12900. In either case, their supporting stop-loss orders should not be placed deeper than 30 pips below their initial entries.
Their first target would be the aforementioned 38.2 per cent Fibonacci. Bulls could substitute their fixed stop orders for floating TPs once the price action comes close to 1.13807. That way, they would protect themselves against abrupt dropdowns while also catching a potential upswing further up north.
The next target for the new uptrend would be the 61.8 per cent Fibonacci retracement level at 1.15014. There is also another notable resistance level - the intermediate threshold at 1.14450, which is underpinned by the 300-day MA (in purple).
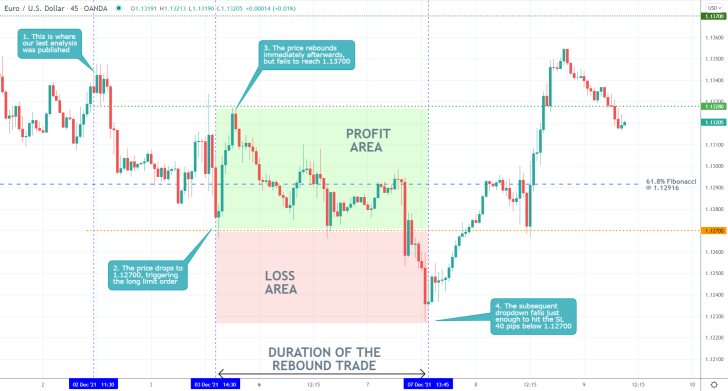
- The expectations of our last EURUSD analysis did not exactly pan out. Shortly after its publication, the price action fell to the major support level at 1.12700 where a long limit order was filled.
- However, the subsequent rebound did not reach the first target at 1.13700. Instead, the following dropdown triggered the stop-loss just 40 pips below the initial entry.
- Similar instances in which the price action falls/climbs just enough to trigger a SL before turning back into the desired direction may be extremely frustrating to traders, feeling that the market is intentionally going against them.
- They should not let the frustration from such coincidences cloud their judgement, and should instead be happy that their SLs had served their ultimate purpose - preventing much bigger potential losses.
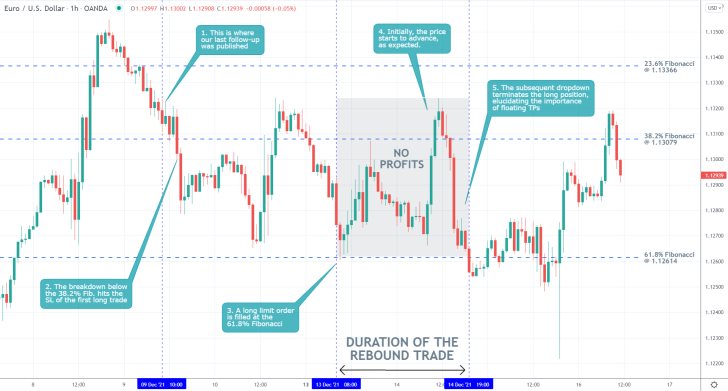
- The expectations of our last follow-up of EURUSD were not realised. No rebound from the 38.2 per cent Fibonacci retracement level at 1.13079 ever occurred, while the rebound from the 61.8 per cent Fibonacci at 1.12614 was terminated abruptly by the subsequent dropdown.
- This is a good reminder of why it is so important to move your stop orders to breakeven after the price action has already moved in your favour by a certain margin. That way, one can be protected from such abrupt changes in the direction of the price action.
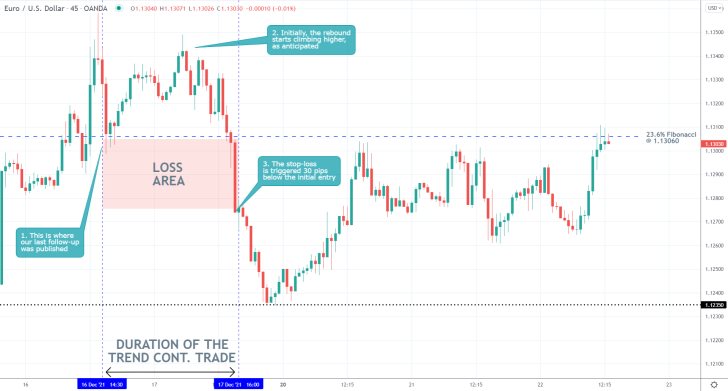
- The expectations of our last EURUSD analysis were not realised. Instead of a rebound from the 23.6 per cent Fibonacci retracement level at 1.13060, the price action broke lower and hit the stop-loss order 30 pips below the Fibonacci threshold.
- The best aspect of the analysis was the narrow stop-loss that was recommended. As can be seen, the dropdown eventually reached the major support level at 1.12350.
Disclaimer: Your capital is at risk! Trading and investing on the financial markets carries a significant risk of loss. Each material, shown on this website, is provided for educational purposes only. A perfect, 100% accurate method of analysis does not exist. If you make a decision to trade or invest, based on the information from this website, you will be doing it at your own risk. Under no circumstances is Trendsharks responsible for any capital losses or damages you might suffer, while using the company’s products and services. For more information read our Terms & Conditions and Risk Disclaimer.


