Temporary bullish momentum on the EURUSD was reinvigorated last week following the adoption of a new inflation goal by the European Central Bank. Nevertheless, the broader sentiment still looks tilted in favour of the greenback, as the U.S. economy continues to recover robustly.
This setup entails a likely continuation of the current pullback towards the next psychologically significant barrier - the 61.8 per cent Fibonacci retracement level - before there is chance for another reversal. Such a type of environment is suitable for the implementation of contrarian trading strategies once the present swing is terminated.
The most likely catalyst for another dollar rally will be the highly anticipated inflation data in the U.S. that is scheduled for publication throughout this week. That is why bears should be looking for any definite signs of reversal in the very near term.
Wyckoff Cycle in Effect
The behaviour of EURUSD's price action over the long term is characteristically proportionate, establishing sharp swings and turns as per the expectations of the Wyckoff Cycle Theory. As can be seen on the daily chart below, it is currently developing a new Markdown following the breakdown below the last Distribution range.
This range was on the same place as the previous Distribution, which is demonstrating that the Wyckoff Cycle expectations are indeed in effect at present.
The current bullish momentum was initiated after the price action probed the upper boundary of the Re-Accumulation range at 1800.00. This is to be expected as misleading swings are commonly found as the price action nears such distinct boundaries of Wyckoff structures.
In other words, once the current upswing reaches a new peak, the broader downtrend is likely to be resumed. This is likely to happen around the 61.8 per cent Fibonacci retracement level (as measured against the last Markup) at 1.19186. This psychological threshold has turned from a support into resistance, which is why the price action is likely to test it from below.
Notice that the last Markup and Markdown both took the forms of 1-5 impulse wave patterns, as postulated by the Elliott Wave Theory. This means that the same is likely to be true for the currently developing Markdown.
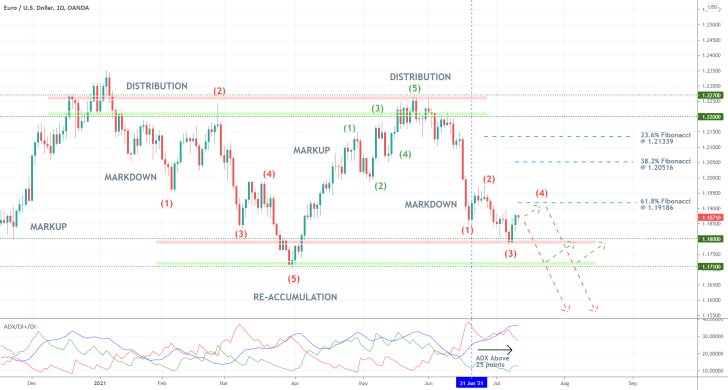
Seeing as how the price action started developing its second retracement leg (3-4) after it rebounded from the upper boundary of the last Re-Accumulation, it would make sense for the price to peak near the closest psychological resistance. This is the 61.8 per cent Fibonacci as it is positioned below the peak at point 2.
These expectations are further bolstered by the fact that the underlying sentiment is ostensibly trending. This is inferred by the current reading of the ADX indicator. The latter has been threading above the 25-point benchmark since the 21st of June, which coincides with the completion of the first impulse leg (0-1). Under these conditions, it would be highly unlikely if the current bullish pullback evolves into a more substantial Markup.
The first two targets for the underlying Markdown - after the anticipated reversal takes place - are underpinned by the boundaries of the last Re-Accumulation range. Hence, bears should look at the temporary behaviour of the price action once it reaches 1.18000 and 1.17100 before it could continue to dig deeper. Both of these levels could initiated additional short-lived bullish pullbacks.
Pinning Down the Anticipated Reversal
The most recent price action is represented as a descending channel on the 4H chart below. It encompasses the peaks and bottoms of the current 1-5 impulse wave pattern. When examined in conjunction with the aforementioned factors, the direction of this channel confirms the expectations for another reversal.
More specifically, the price is likely to reverse from the upper limit of the channel. Notice that the latter is converging with the 61.8 per cent Fibonacci, which makes it an even more substantial turning point.
For the time being, however, the short term bullish momentum is more pronounced. This is underscored by the histogram of the MACD indicator.
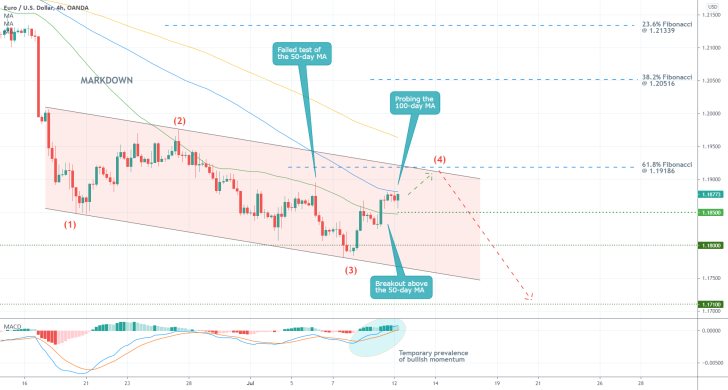
Additionally, the price action is currently concentrated between the 50-day MA (in green) and the 100-day MA (in blue). This yields an important support level at 1.18500, which can be viewed as a temporary threshold for the underlying bullish sentiment.
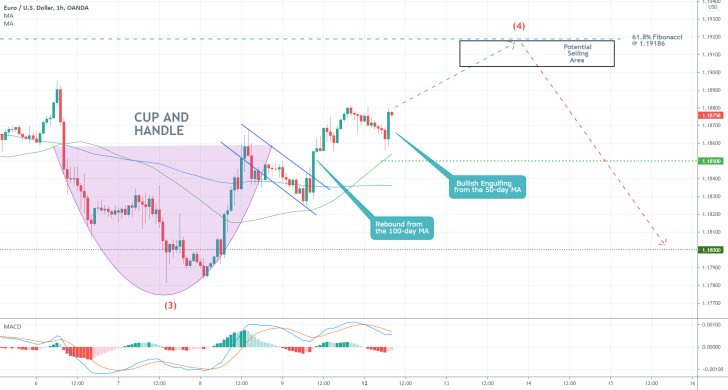
The price of the EURUSD is thus likely to continue appreciating from 1.18500 and heading towards 1.19186 before the bullish momentum could be checked. Another reason to expect this stems from the fact that the 150-day MA (in orange) is drawing near to the 61.8 per cent Fibonacci.
Bears should not rush to sell right away as bullish bias is indeed taking prevalence over selling pressure in the short term. This is elucidated by the emergence of a Cup and Handle pattern on the hourly chart below. The latter substantiates the projections for continued appreciation towards 1.19186.
Concluding Remarks
Bears should only consider going short if the price action does indeed reverse from the 61.8 per cent Fibonacci retracement level. They can then place tight stop-loss orders around 1.19200.
As was alluded to earlier, the Re-Accumulation range's lower boundary at 1.17100 represents one of the two major targets for the underlying Markdown. Bears can aim for such a dropdown, however, they should also be mindful of potential rebounds before the price can sink so low.
Range-Trading Opportunities on EURUSD
Over the last few days, the EURUSD pair entered into a minor consolidation as the market still prices in the impact of FED Chair Jerome Powell's testimony from Tuesday. The dollar was hit by temporary weakness from Powell's remarks, though the tumble was not massive.
This upsurge in adverse market volatility has set two clearly visible boundaries of said range, which is creating an opportunity for the utilisation of range trading strategies in the short term. This opportunity is likely to remain active while the EURUSD takes a temporary break from developing the broader trend.
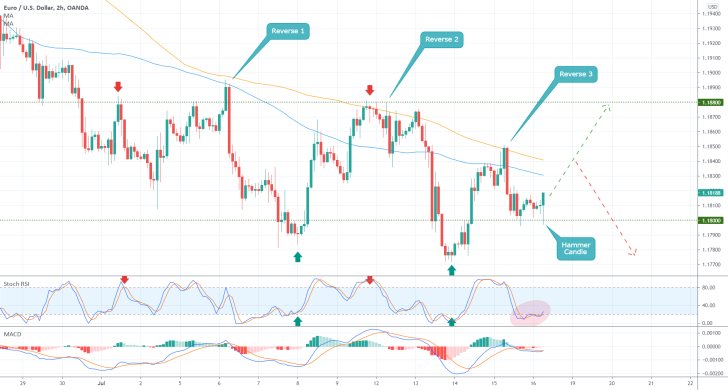
As can be seen on the 2H chart above, the consolidation range spans between the psychologically significant support level at 1.18000 and the major resistance at 1.18800.
The Stochastic RSI indicator is applied to study the evolving equilibrium between buying and selling pressure. Recently, the RSI has entered into its Oversold extreme, which implies a likely increase in buying pressure over the next day or two.
The emergence of a Hammer Candle from the lower boundary of the range is especially interesting because this is a type of candle that typically signifies potential bullish reversals. When considered in conjunction with the aforementioned factors, there seems to be a confluence of underlying signals all pointing to a likely upswing towards 1.18800.
Meanwhile, the MACD indicator is underpinning more or less neutral market momentum, which confirms the range-trading environment.
Bulls looking to buy into the market near the lower boundary of the range should keep in mind that the price action remains concentrated below the 100-day MA (in blue) and the 150-day MA (in orange).
Moreover, the price action has already reversed itself from the 150-day MA on three separate occasions in the past, which could jeopardise the establishment of an upswing towards 1.188000.
In other words, bulls who enter long near the current market price should be mindful of the likelihood of another reversal from the 150-day MA. That is why they should place tight stop-loss orders just below the psychological support.
If the price were to drop to the last swing low once again (around 1.17800) only to consolidate above it yet again, this could give bulls another opportunity to go long, just below the range, at a discount.
Breakout Play on the EURUSD
The EURUSD has consolidated in a narrow range over the past several days in anticipation of the July FED meeting, which is taking place on Wednesday. Jerome Powell and his colleagues from the FOMC are expected to reaffirm their stance on inflation, as consumer prices are expected to rise moderately above 2.0 per cent in the third quarter.
The dollar is likely to be bolstered only on the condition that the Committee emphasises the expected rate hike in 2023. In all other cases, FED's dovishness is likely to keep pressure on the recuperating greenback. Despite its ongoing strengthening, there are plenty of reasons to expect a minor bullish pullback on the EURUSD in the short term.
Chiefly, the earnings season in the U.S. is about to reach its climax this week with prominent releases by the likes of Tesla, Amazon, Apple, and Microsoft. If Big Tech fails to deliver on investors' expectations, the fallout from the stock market is likely to have an adverse impact on the greenback in the short term.
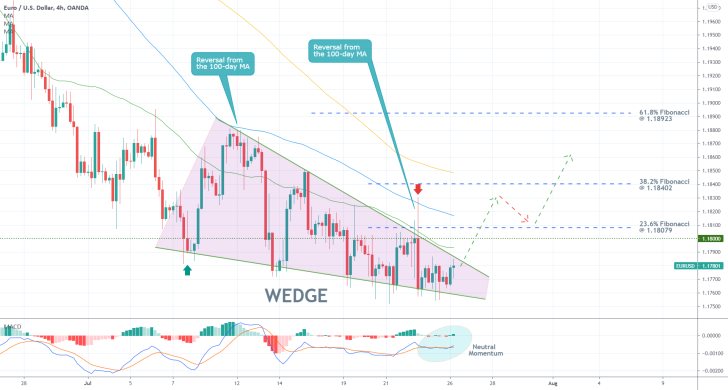
The aforementioned consolidation takes the form of a Descending Wedge, as shown on the 4H chart above. When found at the bottom part of a major downtrend, this type of pattern typically signifies likely bullish reversals. In other words, a decisive breakout above the upper boundary of the Wedge would clear the way for the emergence of a bullish pullback.
The consolidation is currently reaching the bottleneck of the Wedge (the narrowest point of the pattern), which means that such an attempt for a breakout is likely to take place soon. The subdued price action within said bottleneck is underpinned by the neutral momentum on the MACD indicator.
Traders could look for an opportunity around the current market price; however, they shouldn't place their stop-loss levels more than 30 pips away from the entry. They should keep in mind that the price action may continue to fluctuate in range over the next several hours before a decisive breakout occurs.
In addition to the upper limit of the Wedge, the price would also have to break out above the 50-day MA (in green), the psychologically significant threshold at 1.18000, and the 23.6 per cent Fibonacci retracement level at 1.18079. All three constitute significant bearish barriers, so bulls should be cautious of potential sharp reversals. The price action has already changed its direction on the two previous occasions it tested the 100-day MA (in blue).
Even still, if it manages to penetrate above all three barriers, the next most likely target for the pullback would be the 38.2 per cent Fibonacci retracement level at 1.18402.
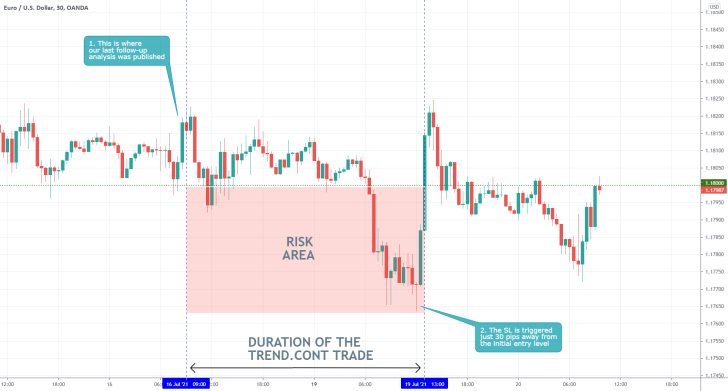
- Our last follow-up analysis of the EURUSD incurred a small loss after the price broke down below the lower boundary of the consolidation range.
- The breakdown fell 30 pips - just enough to trigger the stop-loss order before the price rebounded. This could be quite frustrating to trades feeling almost as if the market has intentionally wiped out their SLs.
- In reality, such adverse fluctuations frequently tend to be the result of market whales collecting SLs, because they know that many retail traders tend to utilise the same entries.
- Such frustration could have detrimental consequences for a trader's psyche if he decides to use deeper SLs afterwards, in order to avoid such adverse fluctuations. That is a mistake.
- Traders shouldn't make any compromises with their risk management.
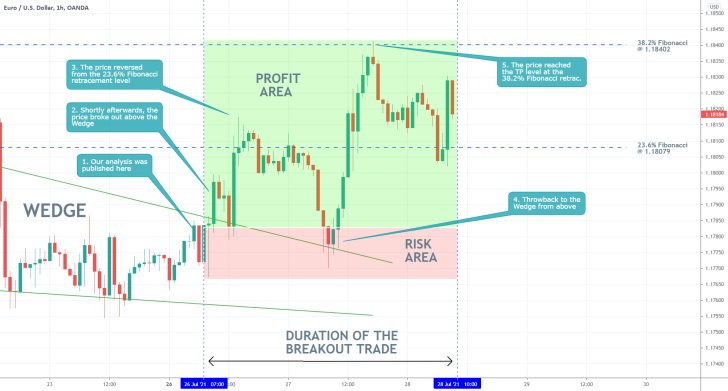
- Our last follow-up analysis of EURUSD successfully projected a breakout above the Wedge pattern. It is worth taking notice of the manner in which the price action established a throwback to the Wedge from above following the initial breakout.
- Some traders might be tempted to close their positions out of fear that the bearish reversal might turn out to be a deeper one; however, such throwbacks/pullbacks are only confirmations of the new market sentiment. They test the new role of a previous support/resistance.
Disclaimer: Your capital is at risk! Trading and investing on the financial markets carries a significant risk of loss. Each material, shown on this website, is provided for educational purposes only. A perfect, 100% accurate method of analysis does not exist. If you make a decision to trade or invest, based on the information from this website, you will be doing it at your own risk. Under no circumstances is Trendsharks responsible for any capital losses or damages you might suffer, while using the company’s products and services. For more information read our Terms & Conditions and Risk Disclaimer.


