The price action of one of the most popular cryptocurrencies in the world continues to behave exactly as per the expectations of the Elliott Wave theory, twisting and turning in a manner that is demonstrative of its fractality and scalability. What that means is that each subsequent wave represents a proportionate leg - whether impulse or retracement - of a broader structure, transcending across multiple timeframe charts.
This scalability and fractality imply that 1-5 patterns on charts with smaller timeframes can comprise elements of broader 1-5 patterns seen on charts with larger timeframes. Hence, traders can take advantage of this aspect of the price action by positioning themselves under these Elliott Wave expectations.
The relatively uneventful economic calendar for this week results in diminished overall trading activity, with the most prominent release scheduled to take place over the next several days being the publication of the latest U.S. inflation numbers. Under these conditions of subdued overall liquidity, adverse volatility is likely to increase on higher-risk assets. This would further increase the likelihood of a correction on Ethereum occurring in the short term.
Ethereum continues to be establishing a massive new downtrend, though the behaviour of the price action in the short term signifies the development of a minor bullish pullback. Bears can therefore try to implement trend-continuation strategies in the long term, while bulls may attempt the riskier contrarian strategies in the shorter term.
Ethereum's Fractality and Scalability Illustrated
As can be seen on the daily chart below, the broader downtrend is represented as a descending 1-5 impulse wave pattern. Its second impulse leg (2-3) was established just above the 61.8 per cent Fibonacci retracement level at 1859.19, and the price action is currently in the process of establishing the second retracement leg (3-4).
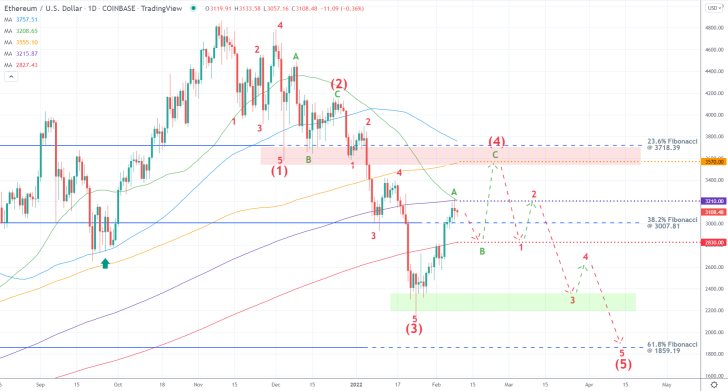
The second retracement leg is likely to take the form of a ABC correction, possibly heading towards the 23.6 per cent Fibonacci at 3718.39. Quite significantly, the price action was able to break out above the psychologically significant threshold at the 38.2 per cent Fibonacci several days ago.
The currently unfolding AB leg is likely to fluctuate between the major resistance at 3210.00 and the major support at 2830.00, with the 38.2 per cent Fibonacci being in the middle. The former is underpinned by the crossover between the 50-day MA (in green) and 300-day MA (in purple), while the latter is underscored by the 400-day MA (in red).
Meanwhile, the 200-day MA (in orange) highlights the lower limit of the major Resistance Area (in red) at 3570.00. Its upper border is represented by the 23.6 per cent Fibonacci, which is about to be crossed by the 100-day MA (in blue). The second major retracement leg (3-4) is thus unlikely to break higher than this resistance area.
The third and final impulse leg (4-5) is then likely to head towards the 61.8 per cent Fibonacci at 1859.19; it is also like to take the form of a 1-5 impulse wave pattern.
Projecting the 3-4 Retracement Leg
The scalability and fractality of the price action are also evident on charts with smaller timeframes, as shown on the 4H chart below. The (5-A) impulse leg is also structured in the 1-5 manner, which is what gives credence to the expectations for the emergence of a minor correction over the next several days.
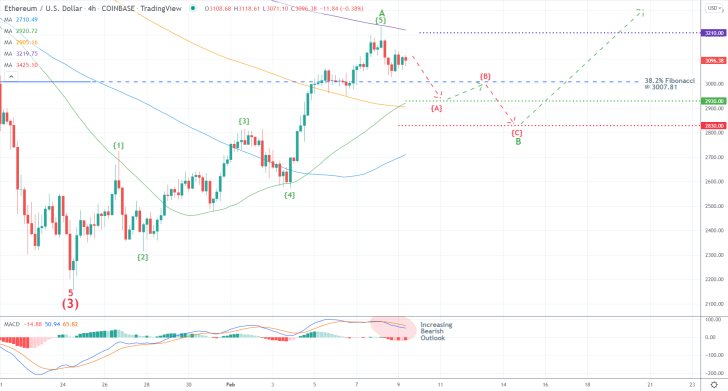
Notice that this last upswing peaked just below the minor resistance at 3210.00, underpinned by the 300-day MA. Meanwhile, the underlying bearish momentum is becoming increasingly more pronounced, as demonstrated by the declining histogram of the MACD indicator. Therefore, bears may have a chance to join the market shortly, while bulls may have to wait more patiently for the dropdown to bottom out before they can buy the dip.
The target for this correction would be the aforementioned support at 2830.00, however, bears should be prepared for possible adverse fluctuations given that the psychologically significant threshold at 3000.00 is found just below the 38.2 per cent Fibonacci. Moreover, the crossover between the 50-day MA and 200-day MA points to a minor support at 2930.00, which is found below the psychological threshold. Therefore, there are multiple barriers from which the eventual dropdown could rebound before it reaches the primary target.
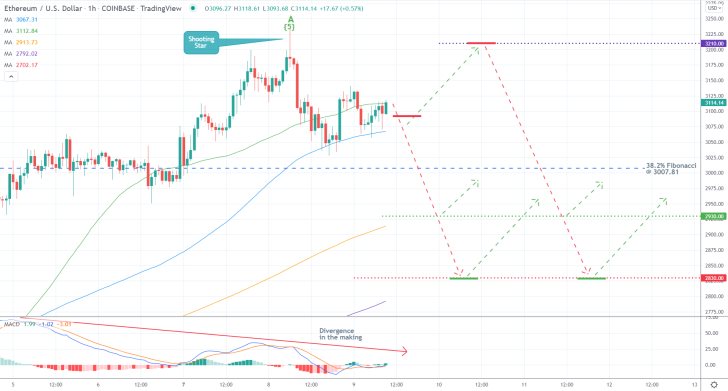
As can be seen on the hourly chart below, the price action is currently consolidating within a minor bottleneck spanning between the 50-day MA (in green) and 100-day MA (in blue). At the same time, the MACD is exhibiting a divergence in the making, corroborating the expectations for a subsequent dropdown. Those are further substantiated by the emergence of a Shooting Star candle at the recent peak.
Finally, it should be noted that the 200-day MA is drawing near the 2930.00 support, while the 300-day MA is doing the same towards the 2830.00 support. This makes the two more prominent turning points.
Concluding Remarks
Depending on their level of risk-aversion, bears can take advantage of this setup in one of two ways. They can either sell around the current spot price (3090.00), or they can place short limit orders at 3210.00. In either case, their supporting stop-loss orders should not be placed higher than $50 above their initial entry levels.
As stated earlier, the major target for the correction would be the 2830.00 support, where bears can collect their profits. However, given the possibility of heightened adverse fluctuations unfolding over the next several hours, bears can protect themselves by implementing floating TPs once the price action penetrates below the 38.2 per cent Fibonacci at 3007.81.
Bulls, in contrast, can place long limit orders at the 2830.00 support level. Their SLs should not be deeper than $40 below this support. Bulls can also utilise floating TPs once the price action rebounds back above the 38.2 per cent Fibonacci.
Ethereum Possibly Developing a Dead Cat Bounce
The price action of Ethereum is currently developing a minor bullish pullback in what looks like the gradual development of a bearish reversal. If realised, this could lead to the establishment of a new downtrend. The reversal itself appears to be taking the shape of a Dead Cat Bounce, which could be utilised by bears seeking to implement contrarian trading strategies.
The temporary strengthening of the cryptocurrency coincided with the pick-up in demand for gold, underlining the heightened global uncertainty. On the other hand, the dollar looks poised to continue strengthening in the coming weeks, which is likely to stave off demand for higher-risk assets.
Given the expectations for another solid increase in U.S. consumption, the underlying bullish bias on the dollar is likely to be bolstered later this week. Consequently, Ethereum bears may look for signs of an imminent reversal.
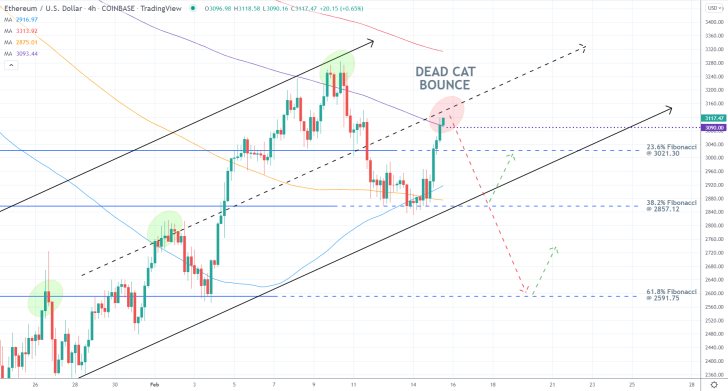
As can be seen on the 4H chart above, the price action of Ethereum has been accelerating within the boundaries of an ascending channel over the last few days. The latest pullback commenced following a rebound from the lower limit of the channel and is about to test its middle line; this is where such a reversal could emerge from.
The development of a Dead Cat Bounce would, therefore, be confirmed if the price action does indeed establish a lower swing peak compared to the last one. Bears should consider entering short only on the condition that the price action closes below the major resistance level at 3090.00. The latter is underscored by the 300-day MA (in purple).
This would entail the execution of short market orders around 3070.00-3080.00. Bears' supporting stop-loss orders should be placed no higher than $150 above their initial entries. Their ultimate target would be the 61.8 per cent Fibonacci retracement level at 2591.75, though a possible rebound could emerge from the 38.2 per cent Fibonacci at 2857.12. That is so because the latter is currently converging with the lower limit of the channel, the 100-day MA (in blue) and 200-day MA (in orange).
Consequently, bears should consider moving their stop orders to breakeven once the price action penetrates below the 23.6 per cent Fibonacci at 3021.30.
Time for an Elliott Correction on Ethereum
The price action of Ethereum has been falling over the past several days, as was forecasted by our original analysis of the cryptocurrency, amidst a general selloff of higher-risk assets. This is being prompted by mounting uncertainty caused by the escalation of tensions between Russia and Ukraine.
Despite the steadily climbing bearish bias, the time seems right for the development of a minor bullish pullback. Earlier today, it was revealed that the German business climate recuperated in February, causing the euro to rebound. Consequently, this is likely to ramp up pressure on the greenback, allowing for such a momentary correction of higher-risk assets.
Bulls can therefore attempt to implement the riskier contrarian trading strategies in a bid to catch the next pullback. Bears, in contrast, could implement trend-continuation strategies at the eventual peak of the correction, seeking to catch the continuation of the broader downtrend.
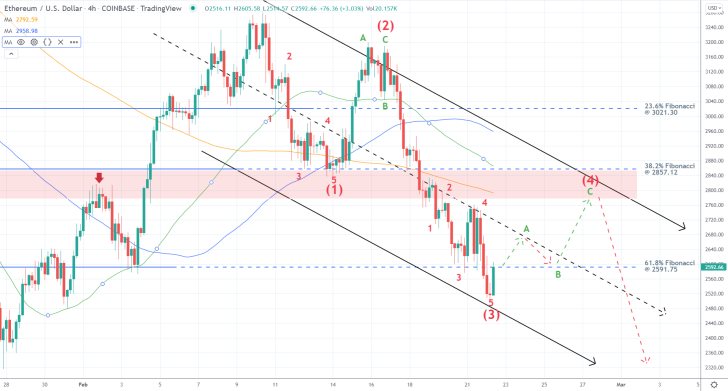
As can be seen on the 4H chart above, the downtrend itself takes the form of a massive descending channel. Moreover, it appears to be structured as a 1-5 impulse wave pattern, as postulated by the Elliott Wave theory. Notice that the second impulse leg (2-3) rebounded sharply from the lower limit of the channel, implying the potential beginning of the second retracement leg (3-4).
The price action is currently probing the 61.8 per cent Fibonacci retracement level at 2591.75 from below. Therefore, the beginning of the second retracement leg could be confirmed provided that the price action manages to close above this major Fibonacci threshold in the next several hours.
The retracement leg itself is likely to take the form of an ABC correction towards the upper limit of the channel that is currently converging with the major resistance area (in red). The 200-day MA (in orange) and 50-day MA (in green) elucidate the strength of the area as a prominent turning point.
Bulls can enter long with market orders just above the 61.8 per cent Fibonacci, provided that the current candle manages to close above it. Alternatively, they can wait for a minor pullback to it from the middle line of the channel before they do so.
Either way, their supporting stop-loss orders should not be placed deeper than $50 below the 61.8 per cent Fibonacci. Once the price action reaches the 2780.00 level, bulls would be able to substitute their fixed stop orders for floating TPs in order to squeeze the maximum out of a potential breakout further up north.
Bears, in contrast, could place short limit orders at 2800.00 with similarly-sized SLs. They can move their stop orders to breakeven once the price action breaks down below the 61.8 per cent Fibonacci.
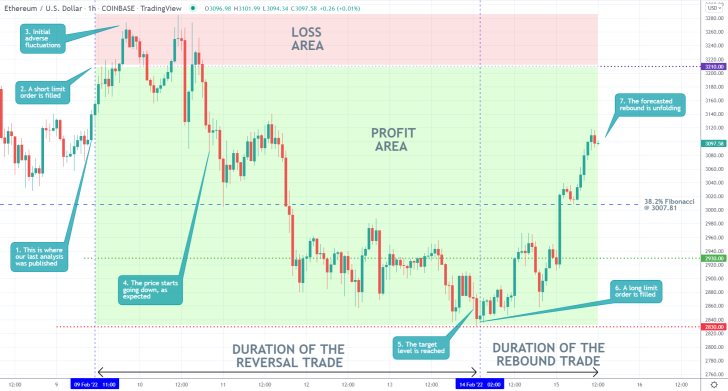
- The forecasts of our last analysis of Ethereum proved a massive success. The price action expectedly reversed from the 3210.00 resistance level, though the adverse fluctuations accompanying the reversal itself were bigger than expected.
- The subsequent dropdown did reach the major support level at 2830.00, where an anticipated bullish rebound did occur.
- The fluctuations around the 3210.0 resistance elucidate that major reversals/rebounds are typically messy. That is why traders oftentimes need to execute several orders before they gain a favourable entry.
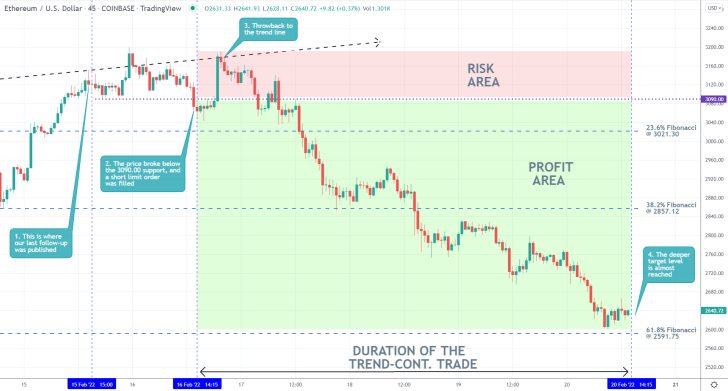
- The expectations of our last Ethereum follow-up were realised. A reversal from the middle line of the ascending channel did occur, and the price action eventually fell to the 61.8 per cent Fibonacci retracement level at 2591.75.
- Even though the initial adverse fluctuations came dangerously close to triggering the supporting stop-loss order, the price action promptly resumed falling.
- Thus, the price action did indeed establish a Dead Cat Bounce pattern, as was expected.
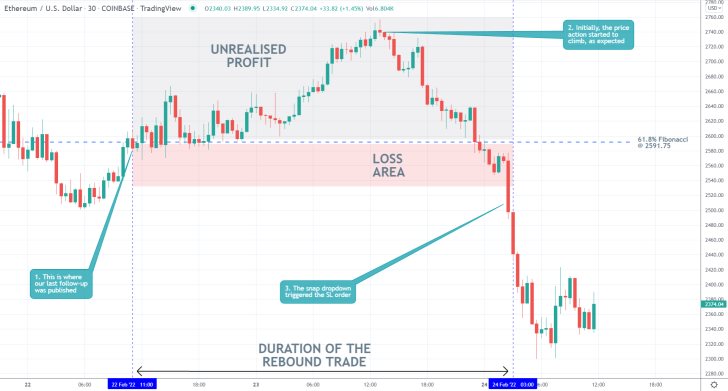
- Even though the price action of Ethereum behaved mostly as expected following the release of our last follow-up of the cryptocurrency, our primary forecasts for a bullish rebound were not met.
- Following temporary consolidation above the 61.8 per cent Fibonacci retracement level at 2591.75, the price action went further up north. However, it was unable to reach the first target level at 2780.00.
- The subsequent dropdown triggered the narrow stop-loss.
Disclaimer: Your capital is at risk! Trading and investing on the financial markets carries a significant risk of loss. Each material, shown on this website, is provided for educational purposes only. A perfect, 100% accurate method of analysis does not exist. If you make a decision to trade or invest, based on the information from this website, you will be doing it at your own risk. Under no circumstances is Trendsharks responsible for any capital losses or damages you might suffer, while using the company’s products and services. For more information read our Terms & Conditions and Risk Disclaimer.


