A bearish reversal on the cable has been expected for quite a while now, and economic data from this week may finally catalyse such a drop. The release of the latest consumer price data in the U.S. on Thursday is projected to underpin a sizable decrease in inflation on a monthly basis, which would be inlined with FED's medium-term estimations.
If the preliminary market forecasts are realised, traders and investors will have fewer reasons to fear inflation getting out of control, which would mean that FED's massively accommodative policy stance is not yet a threat to recovery. This would, in turn, support the greenback, which has been recuperating as of late.
Most underlying fundamentals seem to be pointing to a likely upsurge in bearish pressure on the GBPUSD over the next several days, which creates interesting opportunities for the utilisation of contrarian trading strategies.
The Completion of a Double Top
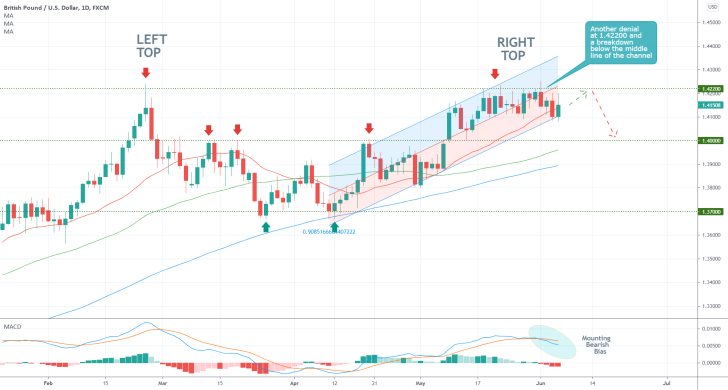
As can be seen on the daily chart below, the GBPUSD has been developing a massive Double Top pattern, which is typically taken to signify likely bearish reversals, for quite a while now. The gradual development of this structure was observed in our last analysis of the cable as well, which attests to its significance.
The price tested the major resistance level at 1.42200 on several occasions while establishing the Right Top, which demonstrates the inability of bulls to drive the price action higher. This could be interpreted as an early indication of mounting bearish pressure, which is also underscored by the MACD indicator.
As a consequence of this temporary consolidation below 1.42200, the price action transitioned within the lower part of the regression channel. It is currently concentrated between the middle line of the channel, which converges with the 1.42200 resistance, and the lower end of the channel, which is being crossed by the 20-day MA (in red). This behaviour of the price, too, elucidates rising selling pressure.
While it is still possible for the price action to test the major resistance at 1.42200 one more time before the reversal is completed, the general outlook is becoming increasingly more bearish.
A decisive breakdown below the channel's lower boundary would allow for a subsequent test of the psychologically significant support level at 1.40000. The latter has served as a prominent turning point on at least three separate occasions in the past, which is why it represents such a crucial threshold.
By the time the price action reaches this psychological barrier, it would likely converge with the 50-day MA (in green). The latter serves the role of a floating support and could potentially prompt a rebound around said level.
However, if the price of the GBPUSD manages to penetrate below the 50-day MA and the 1.40000 support, its next target would be the 100-day MA (in blue). The latest uptrend began its development around the time the price last tested the 100-day MA, which underscores its importance.
Breaking the Ascending Wedge
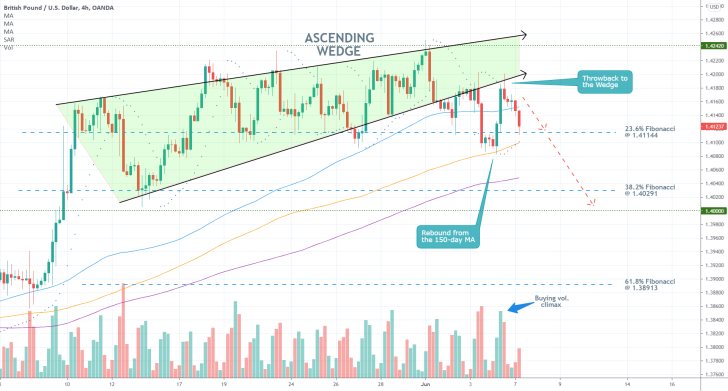
The bearish reversal takes the form of a breakdown below the Ascending Wedge that is illustrated on the 4H chart below. Notice that following the initial penetration below the lower end of the Wedge, the price rebounded from the 23.6 per cent Fibonacci retracement level and the 150-day MA (in orange). Afterwards, it established a throwback to the Wedge from below.
On the surface level, this behaviour of the price action looks erratic and unpredictable. However, it actually represents an intricate component in the transition of the underlying market sentiment - from bullish to bearish.
The price is presently concentrated below the 100-day MA and above the 23.6 per cent Fibonacci. If it manages to break down below 1.41144 decisively, it would then be cleared to head towards the next major target - the 38.2 per cent Fibonacci retracement level at 1.40291. Bears should be cautious of potential rebounds from the 150-day MA and the 200-day MA (in purple), which are positioned between the two Fibonacci barriers.
Buying volume has already climaxed, which is to be expected if the price action is indeed to reverse itself.
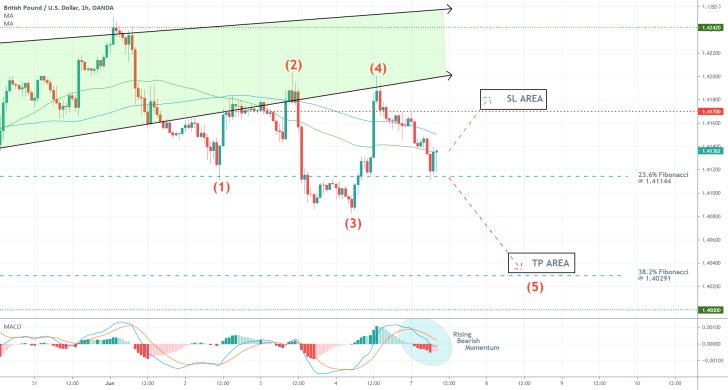
The temporary consolidation of the price above the 23.6 per cent Fibonacci can be seen in greater details on the hourly chart below. It represents an intermediate stage in the development of a bearish 1-5 impulse wave pattern, as postulated by the Elliott Wave Theory. Namely, the price is about to conclude the final impulse leg (4-5), which is likely to be extended towards the 38.2 per cent Fibonacci.
This prevailingly bearish sentiment in the short term would remain active for as long as the price action remains concentrated below the 50-day MA (in green) and the 100-day MA. It is also underpinned by the MACD indicator.
Concluding Remarks:
Bears looking to take advantage of this selling opportunity should place their stop-loss orders no higher than the minor resistance level at 1.41700. Meanwhile, their first target level can be found at 1.40291. If the price manages to break down below it too, then bears can eye a potential dropdown to the psychological support at 1.40000, as stated earlier.
GBPUSD is Slowly Breaking Down Below the Distribution
The GBPUSD pair is probing the lower boundary of a major Distribution range in what looks like the early stage in the development of a new Markdown. Bearish sentiment has been rising over the past several days, though the price action still hasn't made any major headway down south.
This week's economic calendar entails several crucial events that could finally prompt the beginning of such a new downtrend. In the UK, the Office for National Statistics is expected to post weaker employment numbers compared to a month prior.
The number of people claiming unemployment benefits is projected to increase by 25 thousand compared to May's decline by 15 thousand. This is likely to weaken the pound, which is looking increasingly overbought.
In contrast, the Federal Reserve in the U.S. is expected to defend its current policy stance in the face of growing inflation. Wednesday's meeting of the FED is thus likely to support the strengthening greenback.
The GBPUSD is therefore likely to close this week's trading session lower; however, bears should keep in mind that the likelihood of adverse fluctuations prolonging this process remains very much active. That would be the case for as long as the GBPUSD keeps transitioning from the Distribution range into a new Markdown. This is in accordance with the Wyckoff theory.
The current ranging environment is demonstrated by the ADX indicator, which has been threading below the 25-point benchmark since the 24th of May.
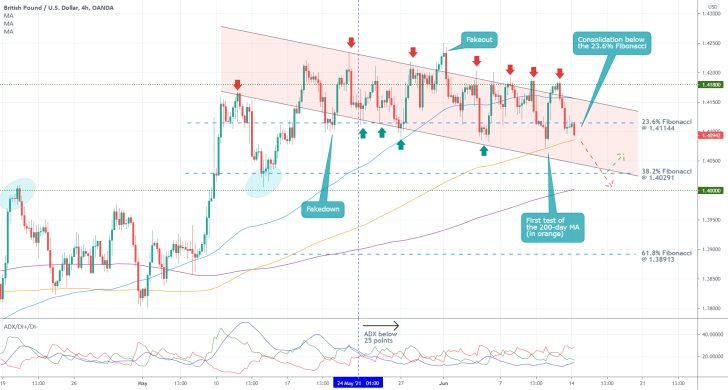
The development of a descending channel elucidates the gradual transition from one market stage into another. The recent reversal from the channel's upper boundary, which also represented a reversal from the 100-day MA (in blue) and the major resistance level at 1.41800, highlights the strengthening bearish bias in the short term.
The price action is testing the 200-day MA (in orange) for a second time while also consolidating below the 23.6 per cent Fibonacci retracement level at 1.41114. This represents the aforementioned preliminary stage in the development of a new markdown.
The next major target is underpinned by the 38.2 per cent Fibonacci retracement level at 1.40291, which is currently coinciding with the channel's lower boundary. If the price does not rebound from the two, the downtrend can be extended lower and towards the major support level at 1.40000.
In addition to its psychological significance (elucidated by the two rebounds in the past), this level also converges with the 300-day MA (purple). Hence, bears should eye the range between 1.40000 and 1.40291 as the first threshold in the development of a new broad downtrend.
GBPUSD's Bullish Pullback Close to Completion
The GBPUSD finally started developing a new downtrend. This has been expected for several weeks now, as it took some time before the underlying bearish commitment got strong enough.
The catalyst for the downturn was last week's FED meeting. On it, Jerome Powell and his colleagues adopted a more hawkish stance, which benefited the dollar. This stance was reconfirmed today, as the FED Chair assured the House of Representatives that inflation growth is not a major threat to recovery.
The FED remains certain that inflation would converge back towards its 2.0 per cent target rate in the longer term after the impact of transitionary supply pressures starts to diminish. For as long as the FOMC remains committed to this outlook, the greenback would likely continue to recuperate.
Meanwhile, the pound is suffering in the short term from the resurgence of coronavirus cases in the UK. This is affecting economic activity as the government is compelled to reintroduce stricter containment measures.
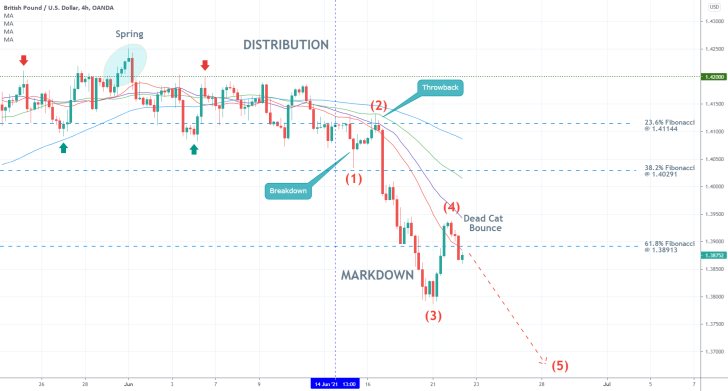
As can be seen on the 4H chart above, the GBPUSD is starting to develop a new Markdown following the completion of an extensive Distribution range. This is happening in accordance with the postulations of the Wyckoff Cycle theory. In other words, the price is likely to continue depreciating over the next several weeks until the Markdown is completed.
For the time being, the new downtrend is taking the form of a 1-5 impulse wave pattern, as postulated by the Elliott Wave Theory. Notice that the first retracement leg (1-2) also represents a throwback to the Distribution's lower boundary. The latter is underpinned by the 23.6 per cent Fibonacci retracement level at 1.41144.
The second retracement leg (3-4), in turn, appears to be representing a false breakout above the 61.8 per cent Fibonacci retracement level at 1.38913. Not only that, but the recent bullish pullback is taking the form of a Dead Cat Bounce. This is a type of pattern that is typically associated with trend-continuation trading.
Market bears seeking to implement such trading strategies can therefore look to sell near the latest peak. They would be expecting to catch the renewal of the broader downtrend. The rationale here would be to catch the next impulse leg (4-5).
Bears can also protect themselves against sharp turns in the direction of the price action by placing narrow stop-losses. They can do so just above the 61.8 per cent Fibonacci retracement level.
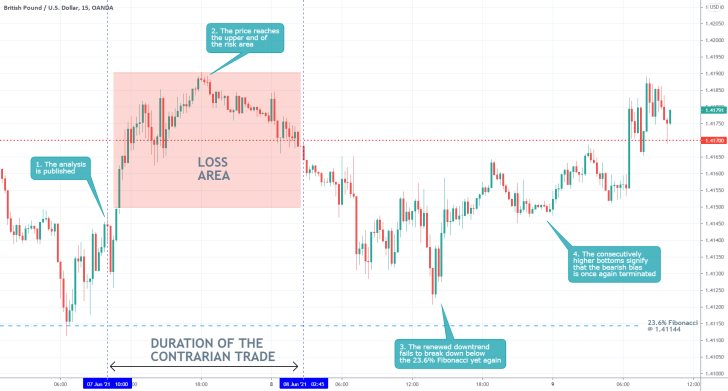
- The GBPUSD did not start falling as was anticipated by our last analysis. Instead, the price action went on to fluctuate in a range between the 23.6 per cent Fibonacci retracement level at 1.41144 and the upper end of the risk area.
- The price action is fluctuating without any apparent direction because market liquidity is greatly diminished at present. The underlying conditions are not suitable for position traders aiming at massive price movements because of summer market seasonality.
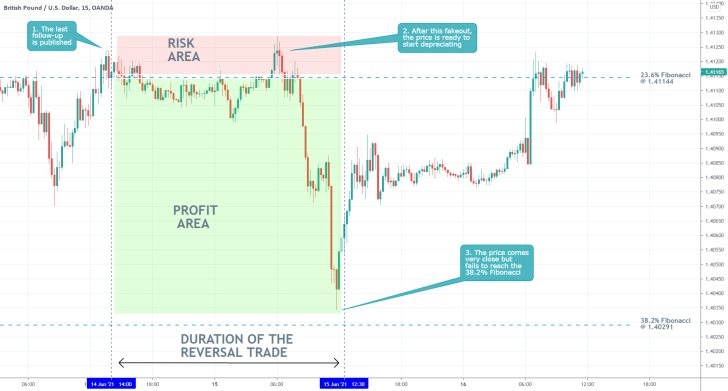
- As expected, the GBPUSD reversed from the 23.6 per cent Fibonacci retracement level at 1.41144, shortly after the publication of our last follow-up analysis. However, the price rebounded before it could fall to the TP level at the 38.2 per cent Fibonacci retracement.
- This is a good example of why more risk-averse traders are better off using floating stop orders so that they can protect themselves against such adverse fluctuations.
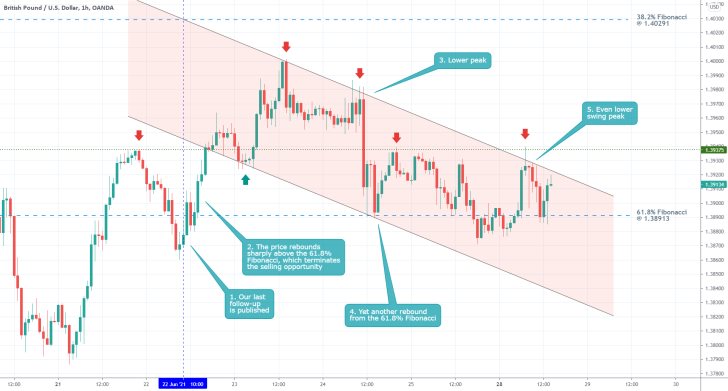
- Even though our last follow-up failed to garner any profits, it did not incur any losses either. Meanwhile, the subsequent behaviour of the price action continues to underpin the prevailingly bearish bias in the short term.
- This is underpinned by the fact that the price action continues to be depreciating within the boundaries of a descending channel.
Disclaimer: Your capital is at risk! Trading and investing on the financial markets carries a significant risk of loss. Each material, shown on this website, is provided for educational purposes only. A perfect, 100% accurate method of analysis does not exist. If you make a decision to trade or invest, based on the information from this website, you will be doing it at your own risk. Under no circumstances is Trendsharks responsible for any capital losses or damages you might suffer, while using the company’s products and services. For more information read our Terms & Conditions and Risk Disclaimer.


