Similar to what we argued concerning the Nasdaq index yesterday, the German DAX seems to be in the same position. German share prices have been rallying alongside the global stocks hike, and now the biggest index in Germany has even managed to reach above the peak that was reached just before the coronavirus crash of early 2020.
While there are no apparent reasons why the DAX should start correcting immediately, an envelope of secondary contributing factors could momentarily stifle its progress. Firstly, there is the upcoming earnings season in the U.S., which is starting in just two days. The expectations for robust quarterly performance by America's bluechip companies could weigh down on European stocks' overall demand.
Secondly, the dollar has already started showing early signs of stabilisation, as expected, which could indirectly have an adverse impact on European shares valued in euros.
Thirdly, the fallout from the persisting political tribulations in the U.S. has already started to jolt global markets, which, in turn, would undoubtedly extend to the European equity market as well.
Finally, German Chancellor Angela Merkel just threatened that the country's strict lockdown measures are likely to be extended until March, given the uptick in confirmed cases. Despite the government's efforts to distribute the coronavirus vaccine as fast as possible, Germany is still far away from overcoming the epidemic. This is likely to curtail some of the vaccine optimism that has been the primary driver of the stock rally in the first place.
Overall, the underlying setup is strikingly similar to the one observed on the Nasdaq yesterday. That is why today's analysis examines the corresponding trading opportunities.
1. Long-Term Outlook:
The price action of the DAX closely mimics the one of the Nasdaq in that the underlying rally was continued only after a major trend-continuation pattern was completed. In this case, it was a Bullish Wedge, as shown on the daily chart below. This behaviour seems to favour the long-term continuation of the uptrend, however, it does not preclude the possibility of minor corrections emerging in the short-term.
What could lead to the formation of such a bearish pullback? Given that the price action has been threading above the major resistance level at 13800.00, which marks the pre-crash peak, for only several days, the timing couldn't be better for traders weighing in on a retracement. In other words, adverse fluctuations are not at all that uncommon around such prominent price levels.
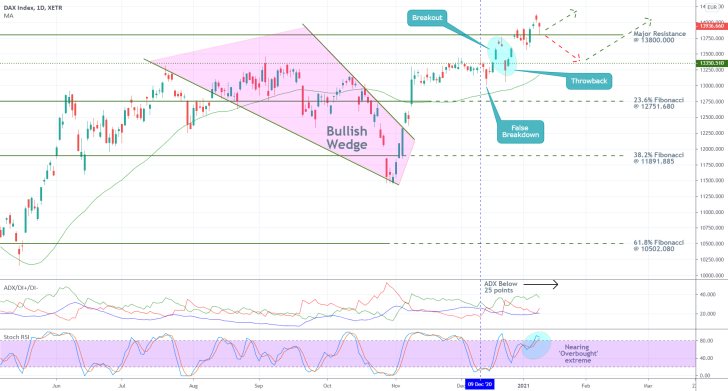
The height of the wedge is at 13350.500, which level was subsequently established as a prominent support. This happened in mid-December last year, when a false rebound, a breakdown, and a throwback occurred around the level in a span of several days. Hence, this support represents the most likely target for a potential correction. This assertion is further substantiated by the fact that the 13350.500 support is currently being reached by the 100-day M.A. (in blue), which represents yet another prominent support. As such, the moving average also serves the role of a key turning point.
The ADX indicator has been threading below the 25-point benchmark since the 9th of December, which implies that the market has been technically range-trading since then. As was mentioned in yesterday's analysis, this type of environment is often conducive to establishing pullbacks.
Moreover, the fact that the Stochastic RSI indicator highlights massive overbuying in the market at a time when it is ranging could prompt more traders to bet on a likely correction in the near future.
2. Short-Term Outlook:
The Wyckoff Cycle theory is utilised on the 4H chart below, to examine the behaviour of the price action at different stages of its development. As can be seen, the price action is currently contained within the major resistance (presently support) level at 13800.00 and the psychologically significant resistance at 14000.000. Due to the aforementioned reasons, this range could turn into an interim Distribution.
Meanwhile, the broader Markup is separated in two by an intermediate Re-Accumulation (in light blue). The two boundaries of this range - 13000.000 and 13350.500 - represent two additional targets for a potential dropdown, with the upper one seeming like a more plausible target.
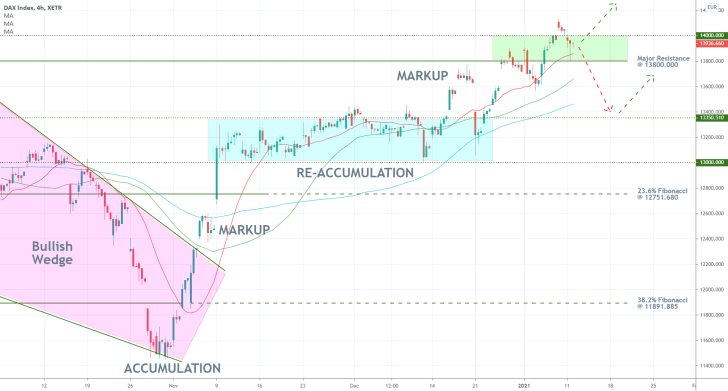
However, market bears need to keep in mind that a potential dropdown, if one does emerge at all, could bottom out even higher. As can be seen, the three moving averages - the aforementioned 100-day M.A. (in blue), the 50-day M.A. (in green), and the 20-day M.A. (in red) - maintain perfect ascending order. Hence, if a pullback does spring up next, it could be terminated at any one of the three.
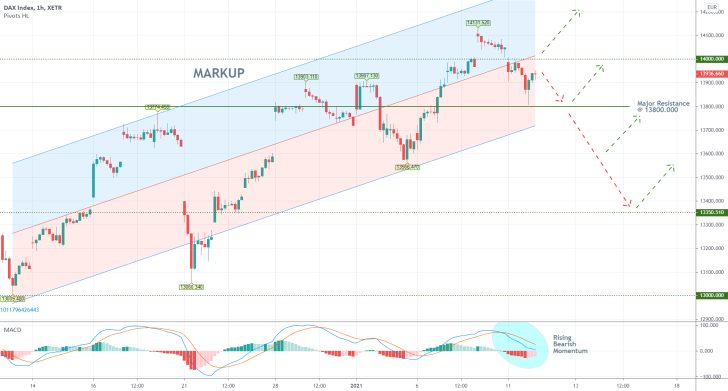
How is the price action behaving in the very short-term? It has recently penetrated within the lower part of the regression channel, which is indicative of rising bearish bias. If it manages to break down below the temporary support at 13800.000, which would soon coincide with the channel's lower limit, this will represent a major indication that the price action would be ready to head towards 13350.500 next.
This assertion is further substantiated by the fact that the MACD indicator has registered a new bearish crossover, which implies that the latest momentum is promptly turning bearish.
3. Concluding Remarks:
Similarly to what was said yesterday regarding the Nasdaq, trading on the DAX should be done only on the condition that the market behaves in a certain way in the near future. Namely, bears should consider using contrarian trading strategies only if the price action manages to break down below the 13800.000 support decidedly. And even so, their positions could be jeopardised by adverse fluctuations.
Meanwhile, market bulls who do not have any open positions can wait for a likely correction to bottom out, so that they can utilise trend-continuation trading strategies then.
Can the DAX Finish Developing a Bullish Pennant?
As was projected in our journal entry from yesterday, the DAX jumped to the psychologically significant resistance at 14000.00, which represents a major make-it-or-break-it point for the direction of the underlying price action. The German index reached this barrier after today's market open on renewed investors' optimism from Joe Biden's inauguration. The stepping of the 46th President into office is generally perceived as a move forward towards curbing uncertainty, which has been rising recently.
The transition of power in Washington was welcomed with equal enthusiasm in Europe where Mr Biden's politics are expected to strengthen the shaken political ties between the two sides of the Atlantic. Heightened enthusiasm in the Eurozone is also having a positive impact on German stocks despite the poor inflationary data that was recorded just a few days ago.
The question is just how much higher can this enthusiasm drive the DAX before it's strength is exhausted. At present, the index is consolidating within the boundaries of a Bullish Pennant pattern, which implies a probable breakout north. The emergence of such a trend-continuation structure within an existing uptrend is unsurprising, however, there are also reasons to expect the contrary.
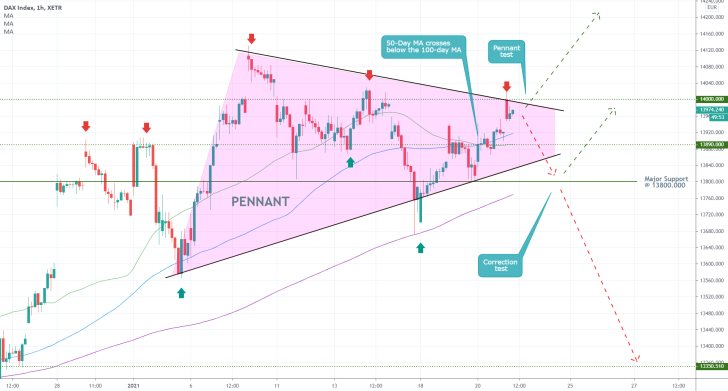
As shown on the hourly chart above, the price action is threading just below the psychological resistance at 14000.000. The last time it did so, it led to a 300 basis points correction, which is why contrarian traders would be looking for more evidence of another rebound. These expectations are also substantiated by the fact that this psychological resistance is currently coinciding with the Pennant's upper edge.
In other words, these converging resistances - one fixed and one descending - make it more difficult for the development of a decisive breakout at the present rate, which, consequently, increases the likelihood for the formation of another bearish pullback. And it is precisely a decisive breakout past the 14000.000 mark that is needed so that market bulls can successfully implement trend-continuation strategies.
Meanwhile, bears hoping for a correction need to closely monitor the price action's behaviour around three crucially important areas. Those include the interim support at 13890.000, the significance of which has already been confirmed on three separate occasions; the lower limit of the Pennant pattern; and the major support level at 13800.000. Each one of these could potentially terminate any emerging correction during its initial stages.
Notice that the 50-day MA (in green) has already crossed below the 100-day MA (in blue), which elucidates rising bearish pressure as of recently. This behaviour is also likely to be followed by at least one more probing action of the price action below the two moving averages.
The 200-day MA (in purple) encompasses the most substantial test for such a potential correction, as it has already terminated one bearish pullback before. It is also worth mentioning that this moving average is currently converging towards the major support level at 13890.000, which makes the latter an even more significant turning point.
DAX Bulls Ready to Charge Again
The biggest stocks index in Germany looks poised to resume trading higher. Our latest follow-up analysis of the DAX successfully projected the recent bearish correction, which is now concluded. This can be affirmed following today's open with a positive gap. What remains to be seen is whether this reinvigorated bullish pressure is strong enough to continue driving the price action further north, past a historic resistance level.
German stocks were not left unscathed by the recent GameStop controversy, which increased the levels of uncertainty on the global stock market considerably. Nevertheless, the situation appears to have reached its climax, at least for the time being, which has allowed the underlying levels of adverse volatility to start waning. This is good news for investors eyeing further gains on the DAX.
This week's economic calendar is mostly missing any major releases in the EU's biggest economy, which would likely keep the levels of adverse volatility low. Meanwhile, investors continue to perceive the ongoing vaccine rollout in Germany as a major negation of the fallout stemming from the country's rigid restrictions.
Overall, there are plenty of bullish factors to look to for a probable continuation of the underlying DAX rally; however, these are not robust enough to suggest an all but certain continuation of the uptrend. In other words, an unexpected development in the near future could potentially jolt the reinvigorated bullish bias.
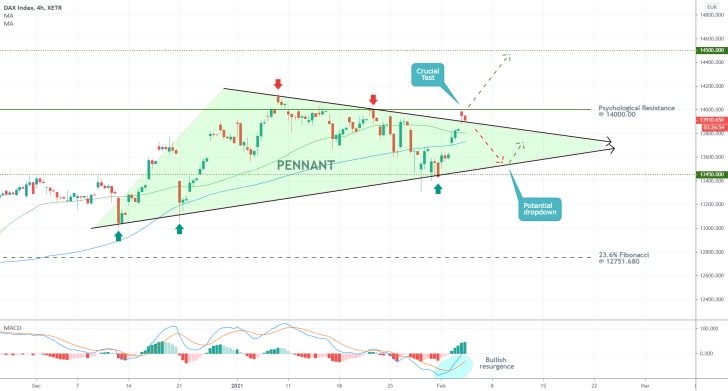
As can be seen on the 4H chart above, the price action is clearly attempting to establish a decisive breakout above the psychological resistance level at 14000.00. The strength of the latter also stems from the fact that it currently serves the role of an all-time peak of the DAX. Consequently, the price action is still anticipated to have a tough time ahead in breaking out above it. Huge fluctuations can also be expected to occur around this barrier.
Frequently, such psychologically significant resistances also tend to function as turning points, which is why the recent bearish correction took place. However, seeing as how a major pennant formation is currently taking shape, a decisive breakout in the near future seems highly probable.
This can happen in one of two ways. Either the price action penetrates above the 14000.000 resistance immediately, in which case the next target will be the 14500.00 resistance, or another bearish pullback unfolds next. In the latter case, the price action would likely retrace to the pennant's lower boundary before another attempt at a breakout occurs. Bulls should keep the likelihood for such a dropdown in mind.
Given the recent uptick in bullish momentum, highlighted by the MACD indicator, coupled with the fact that the price action is concentrated above the two moving averages (the 50-day MA (in green) trading above the 100-day MA (in blue), the underlying bullish pressure is likely to keep mounting.
This scenario is no longer favourable to bears, whereas bulls looking to join the existing uptrend should consider the possibility of potential dropdowns to the lower limit of the pennant. Moreover, they should also keep in mind that as the breakout takes place, the price action is likely to become more volatile and erratic around 14000.000.
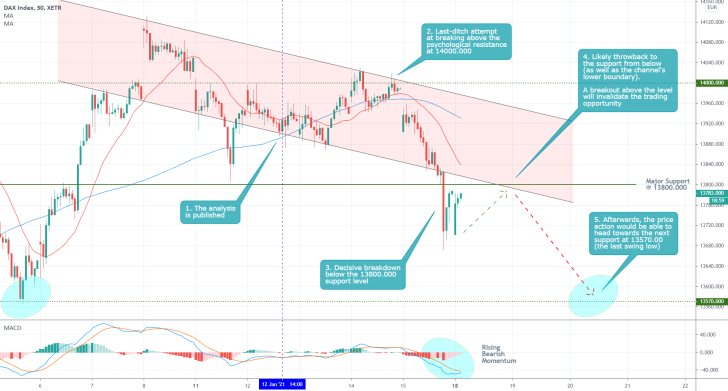
- The analysis expected the price action to immediately head towards the major support at 13800.00 after its publication, however, the price of the DAX rebounded towards the psychological resistance at 14000.000 one last time before the eventual downswing. Now, there is more bearish confirmation in the market, and traders can use this to their advantage.
- The price action is currently consolidating below 13800.000, which can be utilised by bears by placing short orders near the peak of the emerging bullish pullback. As per the original analysis forecasts, the next most likely target-level for the emerging downtrend will be the major support at 13570.000 (the last swing low).
- Keep in mind that the DAX could experience heightened volatility this week due to ECB's monetary policy meeting.
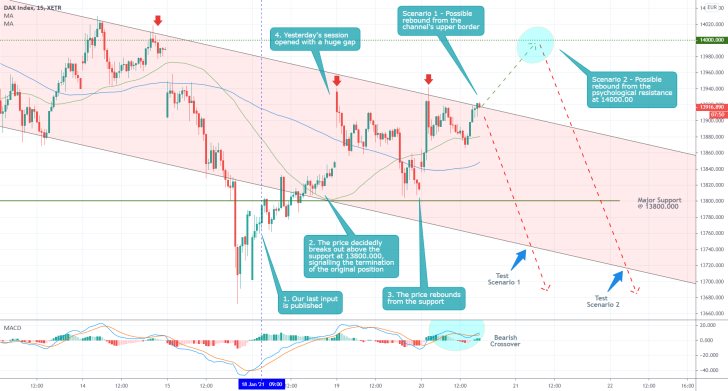
- The price action remains concentrated within the boundaries of the descending channel, though another test of the psychologically significant resistance at 14000.000 seems plausible. The broader sentiment remains tilted to the downside, so the recommendations of the initial analysis remain in effect. Namely, bears could wait for the current bullish pullback to peak before they place their short orders. The chart above illustrates the possibilities for this.
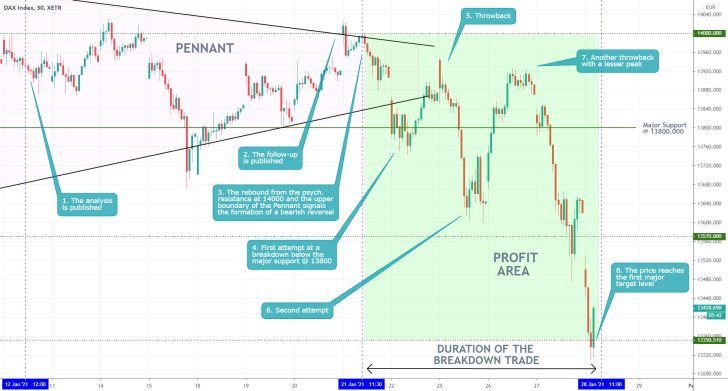
- The strongest quality of the analysis was its timing exactly as the price action was consolidating below the psychologically significant resistance level at 14000.000. It demonstrated quite successfully a scenario in which the price action would rebound from this resistance and head towards the support level at 13350.510, which is what eventually happened.
- The behaviour of the price action around the psychological resistance, the support at 13800.00, and the Pennant's boundaries is encapsulating commonly observed characteristics of a breakout play. As such, it should be studied carefully from the chart above.
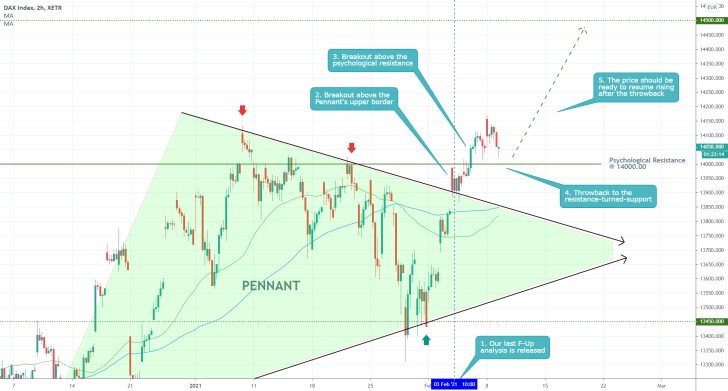
- The price action made two crucial developments - it broke out above the pennant's upper boundary as well as the psychological resistance. Currently, it appears to be in the process of establishing a minor throwback to the resistance-turned-support at 14000.00 before likely resuming to advance higher.
- If the anticipated throwback does indeed bottom out above this crucial barrier with psychological significance, bulls would have an opportunity to add to their underlying positions by buying at the resulting dip.
- Unless the price action retraces below 14000.00, the next target level for the reinstated upswing will continue to be the major resistance at 14500.00.
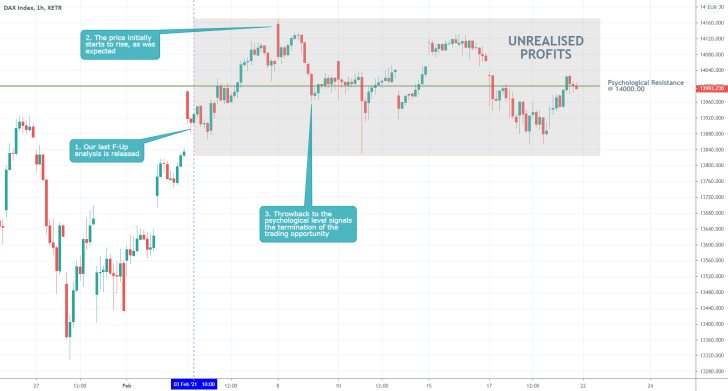
- The longer-term expectations of the last DAX analysis did not quite pan out. Even though the price action did break out above the psychological resistance at 14000.000 temporarily, it was not able to continue the rally afterwards.
- The biggest takeaway here is the need for flexibility. Traders need to keep in mind that it is always a good idea to move their stop-loss orders at least to breakeven after the price starts going in their favour. Otherwise, they risk exposing their positions to adverse changes in the direction of the price action, such as the one above.
Disclaimer: Your capital is at risk! Trading and investing on the financial markets carries a significant risk of loss. Each material, shown on this website, is provided for educational purposes only. A perfect, 100% accurate method of analysis does not exist. If you make a decision to trade or invest, based on the information from this website, you will be doing it at your own risk. Under no circumstances is Trendsharks responsible for any capital losses or damages you might suffer, while using the company’s products and services. For more information read our Terms & Conditions and Risk Disclaimer.


