Gold was thrown on a rollercoaster ride over the past few days as massive volatility upsurges swept through the global capital markets. The first week of March is proving to be just as eventful as the last week of February, with news hitting the market seemingly every hour. The coronavirus panic has been impacting almost every facet of the price formulation processes on the markets, which has prompted massive fluctuations in the underlying prices of many financial instruments.
As a safe-haven asset, gold has been one of those instruments that have been affected the most by the prevailing uncertainty. Since last Friday, the price of the precious commodity has been fluctuating with a rate of daily change of around 3 per cent. Such sudden and massive turnarounds in gold’s price underpin the rapid conversions in the demand pressures that are occurring as news on the coronavirus’ development keeps pouring in.
Directional trading on gold becomes very difficult under the current conditions on the market, however, the behaviour of the volatile price action underlines the prevailing market sentiment, which is currently driven by the rеactions of major central banks. This, in turn, opens up the possibility of trading on the anticipated price swings, which are underscored by the present analysis.
1. Long Term Outlook:
The price of the gold continues to be trading in a significant bullish trend, which was initiated at the height of the trade war between the US and China and is currently bolstered by the rising uncertainty stemming from the spread of the coronavirus. The weekly chart below underlines the historic behaviour of the price action since late 2018.
As can be seen, the price has consolidated in a tight range just below the major resistance level at 1646.00 over the last three weeks. So far it is failing to break out above it and extend the development of the bullish trend because it was recently announced that major central banks would step up in a bid to negate the likelihood of a massive economic contraction. Looser monetary policies would provide enough liquidity in the markets to boost the general economic activity, which would support growth and lessen the negative impact of the stock selloff from last week.
The price's failure to break out above the resistance can be perceived as a potential early indication of the bullish trend's forthcoming exhaustion. Yet, other evidence points towards a likely short-term consolidation before the eventual breakout occurs. The present analysis examines both schools of thought.
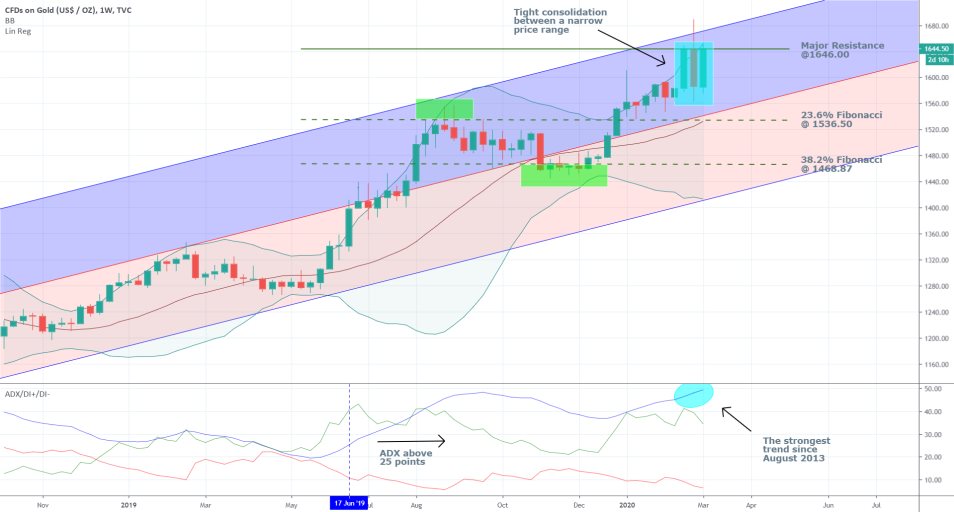
The widening Bollinger Bands are exhibiting the increasing volatility in the market, which seems to be supporting the strength of the underlying trend. The ADX has surpassed the crucial 25 points mark, which confirms that the underlying environment is trending. Furthermore, the indicator demonstrates that the current bullish trend is the strongest one on record since August 2013, which is a piece of evidence favouring the continuation of the trend’s development.
On the other hand, the price action bounced back from the ascending channel’s upper boundary last week, which is a sign that the market bulls are not all-powerful, despite the strong bullish sentiment that is prevailing. A bearish correction might yet emerge as the coronavirus situation continues to be evolving.
It is interesting to note that the Middle Bollinger Band, the 23.6 per cent Fibonacci retracement level, and the ascending channel’s middle line, have all converged on the 1536.50 price level, which is evocative of solid support. Thereby, if a bearish pullback were to form, it would have to test the strength of set support level and break down below it before a significant bearish correction can be commenced.
2. What Will be the Impact of FED’ Rate Cut?
Yesterday the FOMC of the Federal Reserve unexpectedly decided to reduce the interest rate in the US by half a percentage point. Thus, the federal funds rate is currently at 1.25 per cent.
The market largely perceived this sudden decision as a desperate move on the part of the Committee in its effort to negate the negative impact of the coronavirus's spread on the economy. As a consequence, the S&P 500 and other American indices tanked after the announcement, on investors' fears that the situation is only going to worsen in the forthcoming days and weeks. The dollar was weakened on the news as well.
Two crucial reasons have prompted the decline of the greenback over the past several trading days. Firstly, from the outset of the covid-19 epidemic in China and elsewhere, the euro surpassed the dollar as the go-to currency at times of great market unrest and fear. That is owing mostly to the fact that the dollar was already coming towards the end of a long stretch of gains, which market experts reasoned will not continue for much longer. Secondly, under conventional market logic, the reduction of the interest rate in the US is received by investors’ and traders’ anticipations for the weakening of the currency. That is because lesser levels of interest are generally disadvantaging the strength of the underlying currency.
Due to the inverse correlation between the dollar and the price of the gold, the latter should continue to strengthen in the forthcoming days and weeks, as a result of FED’s decision. Correspondingly, the underlying supply and demand balance can tip over if there are some new structural changes in the spread of the virus. For instance, if it is announced that the outbreak is losing steam globally, similar to what happened in China, the demand for the precious metal would likely tumble abruptly. Hence, according to the underlying market fundamentals, the establishment of the current bullish trend would be continued for as long as the general fear continues to weigh down on the market.
3. Short Term Outlook:
The price action on the daily chart below follows a familiar 1-5 wave pattern, under the Elliott Wave Theory. Moreover, it looks as though it is currently in the early stages of establishing the final impulse length, which would mean that the price would surpass the peak at 3.
This bullish sentiment is further supported by the fact that the price has bounced from the minor support at 1577.70, which has resulted in the creation of an inverted hammer – an inherently bullish candlestick. The short-term momentum remains positively bullish, as demonstrated by the MACD, despite the recent bearish crossover.
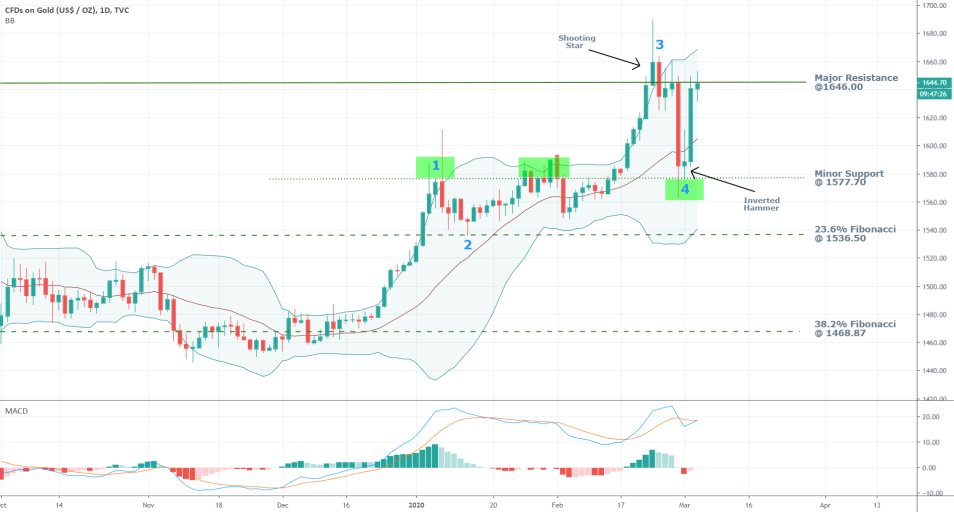
On the other hand, the existence of the shooting star candlestick at the previous high is demonstrative of potential exhaustion of the bullish trend's strength. Additionally, the price appears to be consolidating just below the major resistance level at 1646.00 without succeeding in breaking out above it. This price level is yet another contender for a potential turning point in the direction of the underlying price action.
The Bollinger Bands seem to have reached a peak in their widening, which is illustrative of the waning volatility in the short-term that could be an early indication of a potential stabilization of the price action. This, in turn, would support the termination of the existing bullish trend.
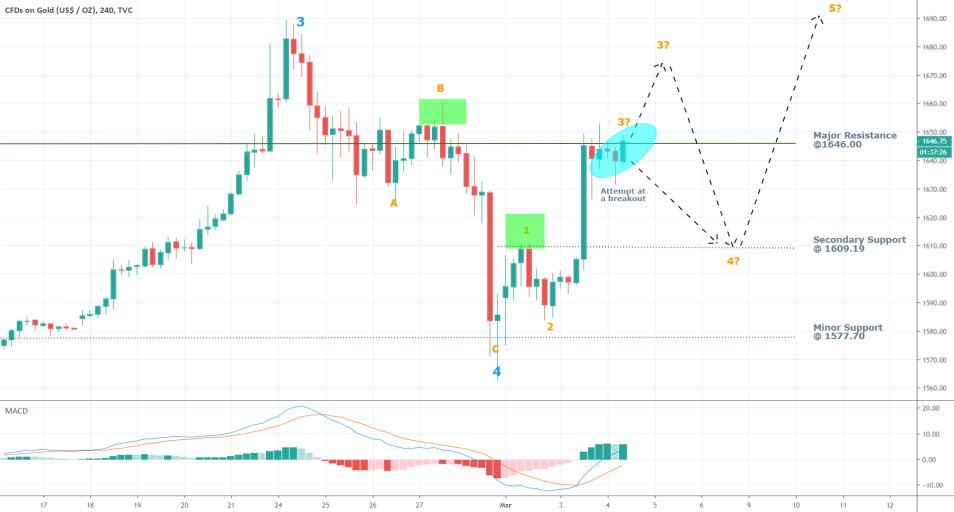
The 4H chart above illustrates the likely future development of the final impulse of the aforementioned 1-5 impulse wave pattern. The MACD is looking ostensibly bullish, which would support the eventual breakout above the major resistance level at 1646.00. If this were to happen soon, then the peak of the minor 1-5 impulse wave pattern at 3 would be placed higher than its current level (at 3?). At any rate, this would be above the peak at “B”, and it would likely be followed by a new pullback to form a dip at “4”.
Conversely, if the price bounces back from the major resistance at 1646.00, it might start heading towards the dip at “4” immediately afterwards. The lowest that this dip of the “3-4” pullback can reach is the secondary support level at 1609.19. Anything less than that would be placed below the peak at “1”, which would effectively break the minor 1-5 impulse wave pattern.
4. Concluding Remarks:
The price of gold continues to be quite volatile due to the constantly evolving situation surrounding the coronavirus spread. Overall, trading should be done with extreme caution. Due to the high underlying volatility, all order-execution will be quite difficult and possibly imprecise. That is why trading with tight entry and exit price levels would be less effective under the current market conditions.
On the other hand, there are reasons to believe that the price action would behave under the general guidelines of the Elliott Wave Theory. If it does, then efficient order executions can be filled at the aforementioned peaks and dips (only if the price behaves in the projected manner).
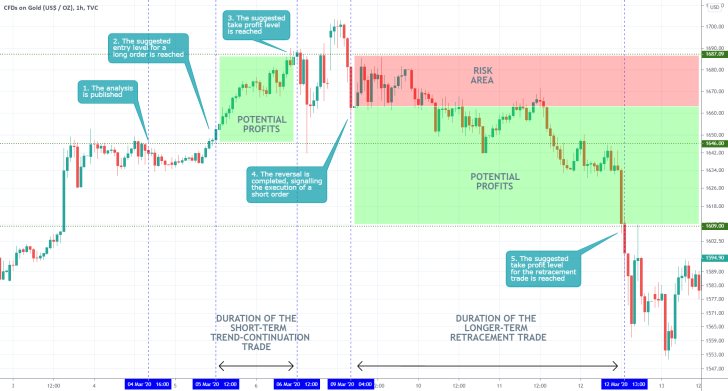
- The analysis does a great job of utilising the Elliott Wave Theory to project future impulses and retracements of gold's price action. The only mistake of the analysis was the expectation for the formation of a final 4-5 impulse leg. Instead, the price resumed falling.
Disclaimer: Your capital is at risk! Trading and investing on the financial markets carries a significant risk of loss. Each material, shown on this website, is provided for educational purposes only. A perfect, 100% accurate method of analysis does not exist. If you make a decision to trade or invest, based on the information from this website, you will be doing it at your own risk. Under no circumstances is Trendsharks responsible for any capital losses or damages you might suffer, while using the company’s products and services. For more information read our Terms & Conditions and Risk Disclaimer.


