Crude oil's price finally recovered fully the losses incurred in the wake of the coronavirus crisis by reaching its pre-crash levels. This happened after the commodity managed to break the psychological 50.00 dollars per barrel threshold. Now there is a new challenge for the rallying energy market.
Part of the reason for the plunge of crude's price in the first part of 2020 was the massively oversupplied market coupled with the abrupt drop in demand for oil as economies started to close down. It was this disparity that drove crude's price to below 0 dollars per barrel. The market has evidently begun to recover since then, mostly owing to the timely interventions by OPEC and also because of the partially reinvigorated global economic activity.
The U.S. economy managed to grow by 4.0 per cent in the fourth quarter, despite deepening epidemic circumstances. Yet, global recovery has been persistently uneven. Inflation has remained subdued in Europe, while prices in the U.S. continue to recuperate. Employment conditions remain tight as industrial activity continues to suffer under the strain of the coronavirus fallout.
While crude's price advance to its pre-crash levels is encouraging news for the energy market, aggregate demand remains way below its levels from before the pandemic despite the uptick in economic activity. This disparity poses a significant test for the bullish commitment behind oil's recent rally. Because the underlying price action has neared such a momentous resistance level, the timing seems perfect for the development of a new bearish correction.
1. Long-Term Outlook:
Crude oil's price action has consolidated below the major resistance level at 54.00 since mid-January, as shown on the daily chart below. This is a crucially important resistance level because, as stated earlier, it has been prevalent since the 20th of February 2020 (immediately before the massive coronavirus crash). It is precisely such psychological barriers that typically cause minor corrections.
These assertions are further substantiated by the fact that the price action appears unable even to test the area above the resistance. Moreover, the recent developments of a Bearish Engulfing and a Shooting Star candles - typically taken to indicate potential bearish reversals - represents yet another reason to expect a new correction to emerge soon.
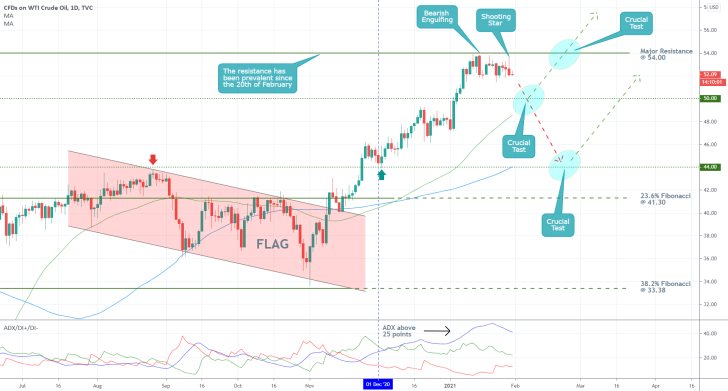
The psychologically significant support at 50.00 seems like the most likely target-level for such a correction because it is already a well-known turning point. The major support level at 44.00 represents the next potential target for a deeper correction. Its significance is confirmed by the fact that it underpins the swing high of the Flag, as well as a swing low of the latest uptrend.
A rebound could naturally emerge from either of these two levels. Meanwhile, breaking out above 54.00 seems like the biggest test for the reinvigorated bullish trend.
Notice also that the ADX indicator has been threading above the 25-point benchmark since the 1st of December, which means that the underlying market sentiment at the present moment is ostensibly trending. This environment makes contrarian trading highly risky in spite of the robust bearish indications, which is why more risk-averse traders could instead wait for such a dropdown to bottom out before they join the existing uptrend.
Finally, it is also worth pointing out that at present, the 100-day MA (in blue) is converging with the 44.00 support, whereas the 50-day MA (in green) is doing the same with the 50.00 psychological support. This makes the two potential turning points even more prominent.
2. Short-Term Outlook:
As can be seen on the 4H chart below, the price action appears to be in the process of developing a triangle just below the 54.00 resistance. Such ascending triangles typically serve the role of interim structures in the development of a broader uptrend. In other words, its gradual development seems to be indicating the likely continuation of the uptrend's progression further north. However, there are other reasons to expect a potential breakdown below the triangle's lower boundary.
Notice that the price action has already failed to break out above the ascending trend line on three separate occasions (highlighted by the red arrows), leaving lower swing peaks each time. This divergence - also underpinned by the MACD indicator - suggests mounting bearish pressure. If the price action establishes one more such fakeout, the likelihood of a subsequent bearish correction would be significantly increased.
Notice also that while the 50-day MA is closing the gap with the 100-day MA, the price action is currently concentrating below the two moving averages. This alone represents a very strong bearish indication. Meanwhile, the MACD recorded a bearish crossover, which also implies rising selling pressure.
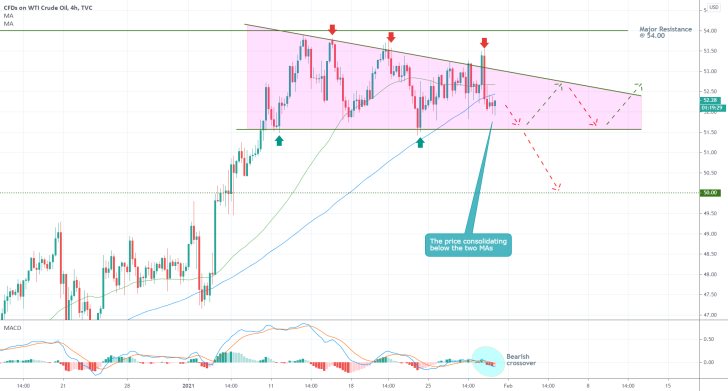
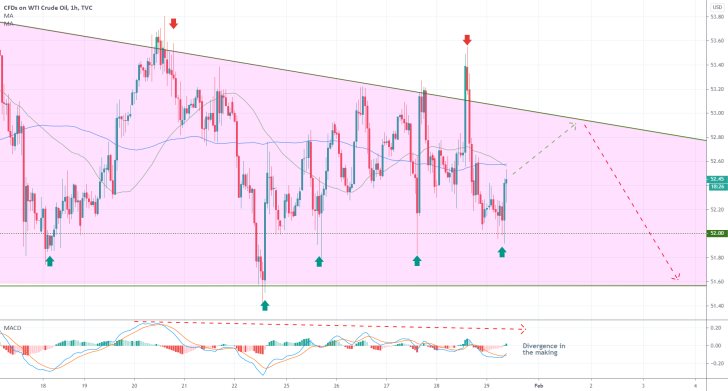
Traders looking to join the market around the current market price need to be cautious. The general focus is currently placed on the stock market and the underlying GameStock controversy, which is leading to more adverse volatility for the commodity. This is due to the diminished trading volume that is causing the price action to fluctuate erratically, as shown on the hourly chart below.
Entries should be carried out near one of the resulting price range extremes, but even this might leave traders exposed to more potential volatility outbursts. The MACD is indeed in the process of developing a Divergence, which affirms the expectations for a bearish correction. However, the recent bullish crossover underpins a sudden upsurge in buying pressure, which could likely drive the price action towards the upper boundary of the triangle once more.
3. Concluding Remarks:
Bears could look for an opportunity to sell crude at a new swing high, provided that the price action goes on to establish another fakeout above the triangle. Such a fakeout needs to be lower than the previous one. The recent bullish rebound from the minor support at 52.00 could end up being the beginning of such a fakeout.
Bears need to keep in mind that their contrarian trading strategies utilised in a robust bullish trend entail a high degree of risk, especially given that they will be eyeing a minor bearish correction (minor compared to the broader uptrend).
That is why more risk-averse traders could instead wait for the market to bottom out near the psychological support at 50.00 (or the major support at 44.00) before they utilise trend-continuation strategies by joining the existing uptrend at the resulting swing low.
Crude is Getting Ahead of Itself
The price of crude oil has had a remarkable bullish run since our last analysis of the commodity was released. The primary reason for the upsurge of more than $6 per barrel since the beginning of February has to do with Joe Biden's fiscal policy plans.
Traders and investors have welcomed the spending plans with great enthusiasm, as they view them as a necessary prerequisite in fostering speedy recovery. The general market opinion is that the U.S. economy needs another boost, especially given the recently recorded weaker-than-expected growth numbers.
The underlying perception is that more government spending will cushion the coronavirus fallout, which is continuing to stifle growth. As economic activity normalises, the aggregate demand for energy would also likely increase, which is why this fiscal spending enthusiasm is inadvertently causing the price of crude to go higher.
Nevertheless, the fact that this market enthusiasm is speculative in nature should not be overlooked. The market is getting ahead of itself, and the current price does not reflect the real demand for the commodity accurately. In other words, the current price of crude oil does not correlate to the underlying activity of the global economy at present. That is why there is a high probability for the emergence of a bearish correction.
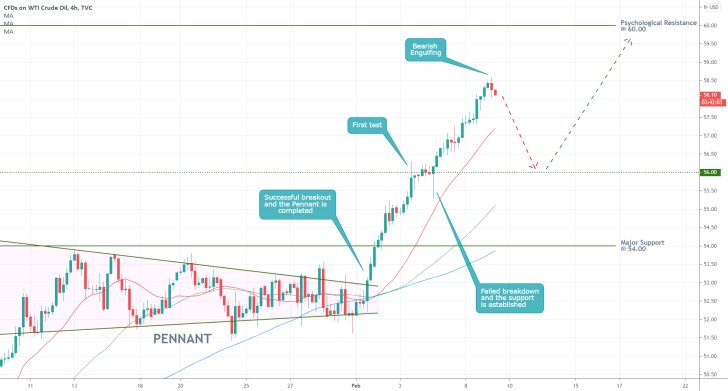
As can be seen on the 4H chart above, the recent upswing sprang up from the Pennant structure; also, from the three moving averages that were converging at that time - the 20-day MA (in red), the 50-day MA (in green), and the 100-day MA (in blue).
The upswing itself is quite vertical, which underpins the possibility for the development of a correspondingly abrupt correction. In other words, the trending environment, albeit being very robust, is likely to foster a sudden dropdown. This likelihood will only increase the nearer that the price action gets to the psychological resistance level at 60.00.
The next bearish correction is unlikely to invalidate the strong bullish uptrend; however, it could cause a dropdown of several dollars per barrel. Arguably, the next most likely target level for such a correction is encapsulated by the minor support at 56.00, whose significance was already confirmed twice. The recent emergence of a bearish engulfing could signal the beginning of such a correction.
Keep in mind that the lowest that a bearish correction could sink to before the bulls regain control is the 100-day MA, which serves the role of floating support. Regardless of how unlikely it seems at present, any breakdown below the 100-day MA would imply the potential termination of the existing uptrend.
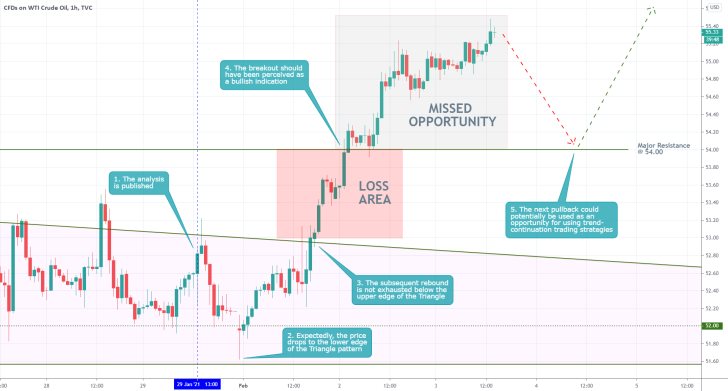
- The projections of the analysis were mostly inaccurate, with the exception of the price action's behaviour immediately following the release of the analysis.
- After the price action broke out above the triangle's upper boundary, this should have been perceived as an indication that the bearish potential is exhausted. It was a good thing that the major resistance at 55.00 was represented in the analysis as a make-it-or-break-it threshold.
- The analysis failed mostly in measuring the current demand for oil, which is what keeps on driving the price of the commodity higher. Nevertheless, the trading opportunity is not entirely gone. Given the robust bullish bias at the moment, an eventual correction (possibly to 55.00) would allow bulls to utilise trend-continuation trading strategies.
Disclaimer: Your capital is at risk! Trading and investing on the financial markets carries a significant risk of loss. Each material, shown on this website, is provided for educational purposes only. A perfect, 100% accurate method of analysis does not exist. If you make a decision to trade or invest, based on the information from this website, you will be doing it at your own risk. Under no circumstances is Trendsharks responsible for any capital losses or damages you might suffer, while using the company’s products and services. For more information read our Terms & Conditions and Risk Disclaimer.


