The price of crude oil rebounded abruptly from the historically significant support level at 61.90 yesterday, which indicated the beginning of a new pullback. However, as it is about to be seen below, the price action also demonstrates signs of mounting bearish commitment in the short term, which bears could use to their advantage.
The snap rebound was prompted by the depreciation of the U.S. dollar from the outset of this week's trading session. The greenback depreciated parallel to the strengthening of other low-risk securities. This temporary corrective movement continues to represent a minor component of a broader uptrend. In other words, the underlying sentiment of the greenback continues to be ostensibly bullish-oriented.
The end of this minor correction is likely to be catalysed by the Jackson Hole Symposium taking place towards the end of the week. FED Chair Jerome Powell is set to expound upon recent talks of a potential FED tapering of the QE programme by early 2021. This is very likely to reinvigorate the greenback.
All of this means that the dollar is likely to begin advancing by the end of the week, which, in turn, would exert more bearish pressure on the price of crude oil. Consequently, bears would have an opportunity to use contrarian trading strategies on the price of the commodity. In particular, they can look for a chance to sell at the peak of the current pullback in the very near future.
Examining Crude's Broad 1-5 Impulse Wave Pattern
As stated above, the latest pullback commenced following a snap rebound from the major support level at 61.90. It serves as a prominent swing low, as shown on the daily chart below. During the development of the preceding uptrend, the 61.90 support level served as a significant steppingstone in its development.
This was the first time that the currently emerging downtrend probed this major threshold, so the subsequent rebound is not that surprising. However, it should not be perceived as a decisive trend reversal. Rather, this represents yet another indication that the pullback is nothing more than an intermittent stage in the development of the broader downtrend.
In fact, this "intermittent stage" appears to be serving the role of the second retracement leg (3-4) of a massive 1-5 impulse wave pattern, as postulated by the Elliott Wave Theory. Hence, as soon as the price action reaches the peak at point 4, the broader downtrend can then be resumed.
This is most likely to happen from the 38.2 per cent Fibonacci retracement level at 69.43; however, it could also occur from the minor resistance at 67.90. The latter is underpinned by the 100-day MA (in blue).
Bears who sell there would be eyeing the continuation of the downtrend past the 61.90 swing low, which is about to converge with the 200-day MA (in orange), into uncharted territory.
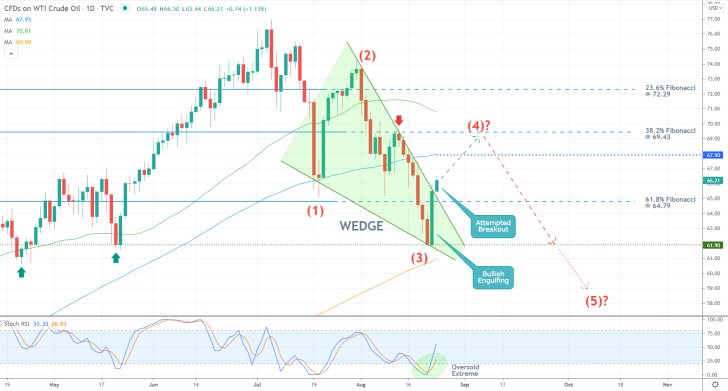
For the time being, the prevalence of bullish bias in the market is signified by the fact that the rebound from 61.90 took the form of a Bullish Engulfing candle, closing above the 61.8 per cent Fibonacci retracement level at 64.79. Not only that, but the price action is also penetrating above the upper boundary of the Descending Wedge pattern, which typically entails mounting bullish sentiment.
When these factors are considered in conjunction with the fact that the underlying selling pressure has already climaxed, as highlighted by the Stochastic RSI indicator, the extension of the pullback higher towards one of the two aforementioned targets seems highly probable.
Trading Opportunities for Bulls and Bears Alike
As can be seen on the 4H chart below, the price action is currently probing the 50-day MA (in green). Bulls and bears alike should watch its behaviour around this crucial floating resistance, as it could create trading opportunities for both.
If the price action fails to break out above it decisively (over the next several hours), a throwback to the 61.8 per cent Fibonacci retracement level is likely to ensue then. While the underlying momentum in the short term remains ostensibly bullish, as illustrated by the MACD indicator, the pullback is not necessarily exempt from forming such throwbacks.
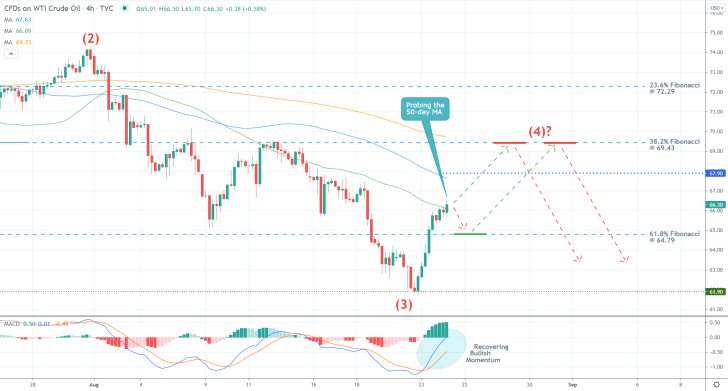
That is why in addition to waiting for the (3-4) retracement leg to peak so that bears can sell (around the 38.2 per cent Fibonacci), they can also look for an opportunity to practice contrarian trading around the current spot price.
Bulls, in contrast, could implement trend continuation trading strategies from the 38.2 per cent Fibonacci level on the condition that a throwback to it does indeed form in the next several hours.
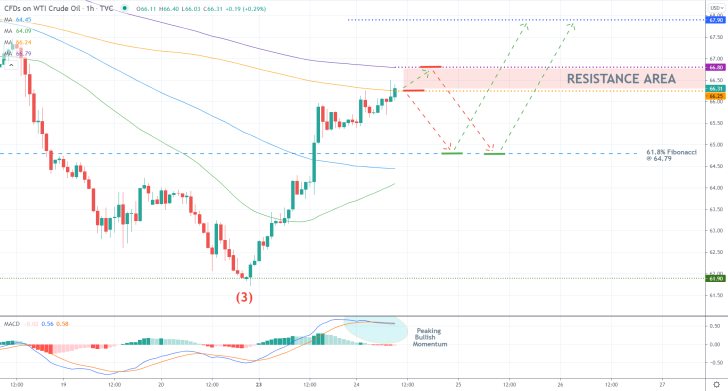
These opportunities can be better perceived on the hourly chart below. This time, the MACD has registered a minor bearish crossover on its histogram, which could be a very early signal of a potential dropdown.
Interestingly, in addition to probing the 200-day MA, the price action is also about to test the 300-day MA (in purple). Using the two moving averages as reference points, a Resistance Area (in red) can be drawn between 66.80 and 66.25.
Depending on their level of risk aversion, bears can look for an opportunity to enter short within this Resistance Area. However, it should be mentioned that using contrarian trading strategies entails a very high degree of risk, which is why they are not suitable for all traders. More cautious bears can instead wait for the price to reach the 38.2 per cent Fibonacci retracement level before they consider entering the market.
Concluding Remarks
Depending on where exactly such less risk-averse bears decide to enter short within the Resistance Area, they should not place their stop-loss orders above 67.10. Bears who enter closer to the lower boundary of the Area should consider placing narrower stop-losses.
The target, as stated earlier, is encapsulated by the 61.8 per cent Fibonacci retracement level at 64.79. This is where bulls can, in turn, place their trend-continuation buying orders. They would be eyeing the likely extension of the pullback to the 38.2 per cent Fibonacci.
Bears would then once again have an opportunity to enter short around 69.43, which is positioned just below the psychologically significant resistance level at 70.00, on the expectations for the continuation of the broader downtrend in the longer term.
Crude Oil Attempts to Push Higher. What Next?
The price action of crude oil currently finds itself at a critical junction. Its immediate behaviour around this make-it-or-break-it threshold would demonstrate whether the recent pullback would continue to appreciate higher or the prevailing downtrend would be ready to resume its development.
Crude oil rallied over the last several days on renewed ruptures in global supply chains. The pandemic remains a major impediment to global transportation logistics, which creates persisting supply bottlenecks. This is the chief reason why inflation remains so high.
And since global demand cannot be satisfied on time, the energy market keeps rising. This is what fuels crude's recent pullback. Yet, FED Chair Jerome Powell's speech at the Jackson Hole Symposium, which is scheduled to take place later today, could tip the supply/demand balance.
Any hawkish remarks in his statement would likely bolster the dollar, which, in turn, would have a fallout effect on the price of crude. That is why the behaviour of the commodity's price action over the next several hours will be so important.
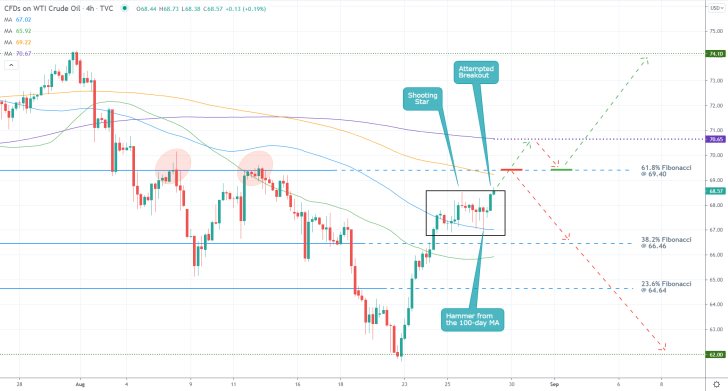
As can be seen on the 4H chart above, the price action is currently probing the upper boundary of the small consolidation area (highlighted by the rectangle). Notice that following the Shooting Star candle (false bearish signal), the price action fell to the 100-day MA (in blue).
Then, a Hammer Candle rebounded from the moving average, which serves as a floating support, and that is how the price action got to testing the upper limit of the range at present. The fact that this rebound emerged above the 38.2 per cent Fibonacci retracement level at 66.46 and the 50-day MA (in green) attests to the solid bullish bias at present.
However, bulls should not take this as a signal to go long right away. That is so because the price action is set to probe several crucial resistances that are currently converging with each other. Case in point, the 61.8 per cent Fibonacci at 69.40 (the last Fibonacci threshold), which is being crossed by the 200-day MA (in orange). Moreover, the psychologically significant resistance level at 70.00 is also very close.
Bulls can consider joining the pullback only on the condition that the price action breaks out above the three decisively. They can wait for a throwback from the 300-day MA (in purple) at 70.65 to the 61.8 per cent Fibonacci. Once the price action falls to 69.40 from above, that is when bulls can place their long orders on the expectations for the extension of the pullback to the previous swing peak - at 74.10.
Bears, in contrast, can place their selling orders around 69.40 on the expectations for a snap reversal towards the 38.2 per cent Fibonacci. Should the correction break down below the latter, the price action could then target the 23.6 per cent Fibonacci at 64.64. Bears should not place their stop-losses above the psychological resistance at 70.00, though they should be mindful of potential adverse fluctuations.
Crude Oil to Break the Last Fibonacci Barrier
Bullish pressure keeps increasing on the price of crude oil. Global energy demand was staved off by persisting supply bottlenecks in the near term, which is expected to be a temporary occurrence.
Another major upswing is likely to be catalysed soon owing to improving economic conditions in the U.S. and elsewhere. The first such positive momentum is likely to take place tomorrow, following the release of the latest non-farm payrolls.
At present, the price action of crude oil finds itself at a significant threshold. If it manages to break out above it, the uptrend is likely to continue higher. Therefore, bulls have a chance to trade on the anticipated breakout by utilising trend continuation trading strategies.
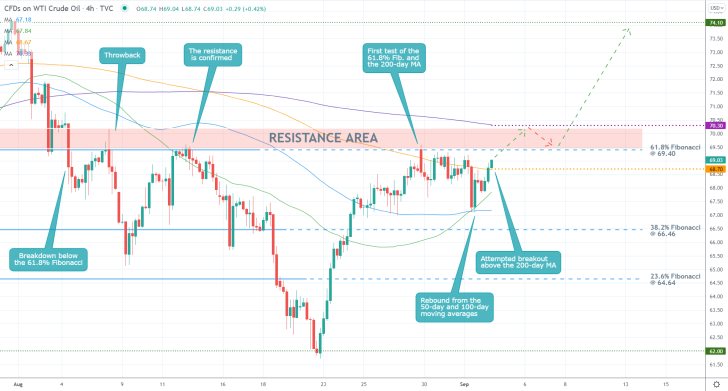
As can be seen on the 4H chart above, the price action is currently consolidating just below the 61.8 per cent Fibonacci retracement level at 69.40, which represents the last Fibonacci barrier. That is why it bears such significant importance. Moreover, the 61.8 per cent Fibonacci is positioned just below the psychologically significant resistance level at 70.00, which in itself represents a major turning point.
Normally, the convergence of so many resistances at one place would signify a likely bearish reversal; however, there are ample reasons to anticipate the opposite.
The current upswing commenced from the last swing low, at 62.00. It went on to establish a minor retracement, which bottomed out just above the crossover between the 50-day MA (in green) and the 100-day MA (in blue). This retracement leg began developing following the first test of the 61.8 per cent Fibonacci and the 200-day MA (in orange).
Given the reinvigorated bullish momentum, there seems to be a high probability of another test of 69.40. This is further substantiated by the fact that the price action has already broken the 200-day MA.
The breakout itself is likely to occur in a similar manner to the last breakdown below the same support-turned-resistance. Meaning that the breakout is then likely to be followed by a pullback to 69.40 from above before the uptrend can be resumed.
Bulls can look for an opportunity to go long around the current spot price, placing their stop-losses just below the 200-day MA (currently at 68.70). They can add to their long positions if the price action reverses from the 300-day MA (in purple, currently at 70.30) and finds support above the 61.8 per cent Fibonacci.
Bears, in contrast, can consider entering short only on the condition that the price action reverses from 69.40 and proceeds to close below 68.70. Their first target is encapsulated by the 38.2 per cent Fibonacci retracement level at 66.46.
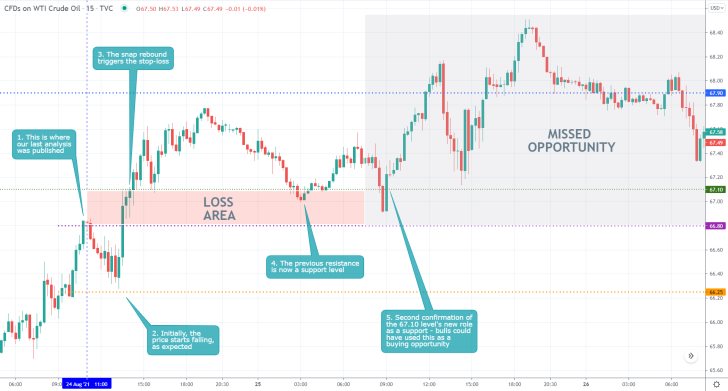
- The forecasts of our last analysis of crude oil were not realised at all. Instead of a reversal from the Resistance Area, the price action went on to continue appreciating.
- Even so, the trade succeeded in more ways than it failed. That is so because of the very narrow stop-loss that was placed just above the 67.10 resistance level, which prevented much bigger losses than the ones already incurred.
- This goes to show that even if you are completely mistaken about the prevailing market sentiment, which can happen to anyone, having strict and consistent risk management rules will always limit your losses and allow you to trade another day.
- It is also interesting to point out the manner in which the 67.10 level turned from a resistance into support, which could have been used by bulls as an indication of rising bullish commitment in the market.
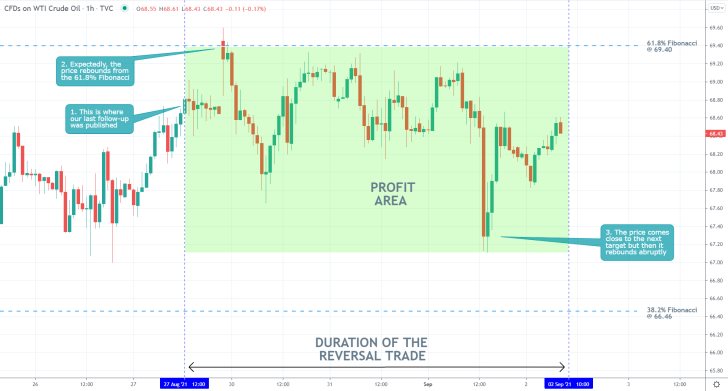
- As per the arguments in our last follow-up, the price action of crude oil did not break out above the 61.8 per cent Fibonacci retracement level, which is why bulls did not open any long orders. However, the price action reversed from 69.40, which allowed bears to place contrarian trades.
- Even though the price action came close to the first target level at the 38.2 per cent Fibonacci at one point, the subsequent rebound drove it away.
- Even still, the trade is closed with a moderate profit ahead of the upcoming U.S. Payrolls for August.
Disclaimer: Your capital is at risk! Trading and investing on the financial markets carries a significant risk of loss. Each material, shown on this website, is provided for educational purposes only. A perfect, 100% accurate method of analysis does not exist. If you make a decision to trade or invest, based on the information from this website, you will be doing it at your own risk. Under no circumstances is Trendsharks responsible for any capital losses or damages you might suffer, while using the company’s products and services. For more information read our Terms & Conditions and Risk Disclaimer.


