The price action of crude oil is long overdue for a bearish correction, though geopolitical tensions are so far preventing it from happening. The escalating tensions near the Donbas border-region of Ukraine are high as Russia keeps on increasing its military presence on its own side of the border. The global energy market has thus been gripped for quite a while by the prospect of a Russian invasion.
This puts additional pressure on Europe's already existing energy crisis, which is what keeps energy prices high. Moreover, soaring inflation and persisting supply bottlenecks globally further elevate the strain on the market, making the supply and demand disequilibrium even wider. For this reason, crude recently broke above $80 per barrel. Further still, global demand is also on the increase, thereby contributing to the heightened demand for crude oil.
The confluence of so many indications means that bullish momentum is almost certainly going to continue prevailing in the coming weeks, though this does not necessarily preclude the possibility of an intermittent bearish correction occurring soon.
The price action is currently probing one major support level, and a breakdown below it would likely signify the beginning of such a bearish correction. That is why the underlying setup seems to be suitable for the implementation of contrarian trading strategies. However, bears should keep in mind that this would entail a comparatively high degree of risk, which is why more risk-averse traders should refrain from joining the market now.
Bulls, too, should be cautious because trading on the expectations for the continuation of the existing uptrend amidst strong bullish indications is far from certain. They have already missed the opportunity to join the uptrend early on, and joining the market at such a late stage would entail a high degree of risk for them as well.
The Structure of a Potential Reversal
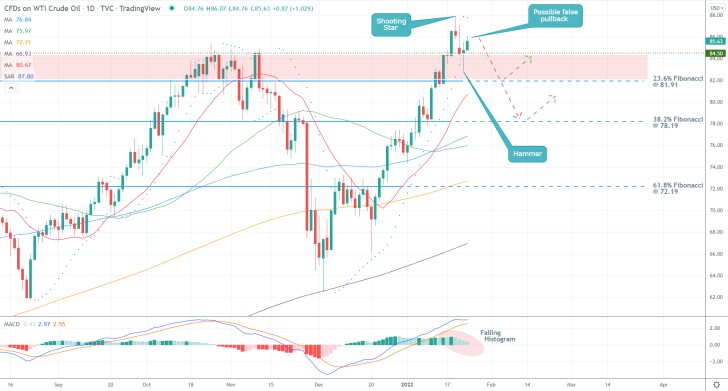
As can be seen on the daily chart above, the strong bullish sentiment is underscored by the fact that the price action managed to break out above the major Resistance Area (in red) recently. It spans between the 23.6 per cent Fibonacci retracement level at 81.91 and the major resistance-turned-support at 84.50.
On the other hand, the behaviour of the price action above this turning area has been mostly volatile and erratic, which could be perceived as an early indication of an upcoming reversal. This is underpinned by the development of a Shooting Star candle at the top of the uptrend, representing a classic reversal candlestick.
It was followed by a retest of the 23.6 per cent Fibonacci from above which was terminated following the emergence of a Hammer candle. Hence, the current pullback from 81.91 could pan out to be a false bullish indication. Meanwhile, the underlying bullish momentum has been falling, as demonstrated by the waning histogram of the MACD indicator.
The first obstacle before the eventual correction would once again be the 23.6 per cent Fibonacci, which is about to be crossed by the 20-day MA (in red), making it an even more prominent support. The next target would be the 38.2 per cent Fibonacci at 78.19.
It should be noted that the psychologically significant threshold at 80.00 can be found just above it, whereas the crossover between the 50-day MA (in green) and 100-day MA (in blue) is positioned just below it. Hence, there are many possible turning points for the correction in relatively close proximity.
Retesting the Ascending Channel
A definite sign of a new correction would be the observance of lower peaks and dips in the waves of the price action. As shown on the 4H chart below, the latest upswing is represented as an ascending channel. Its three waves are comprised of consecutively higher lows and peaks. However, this might be coming to an end.
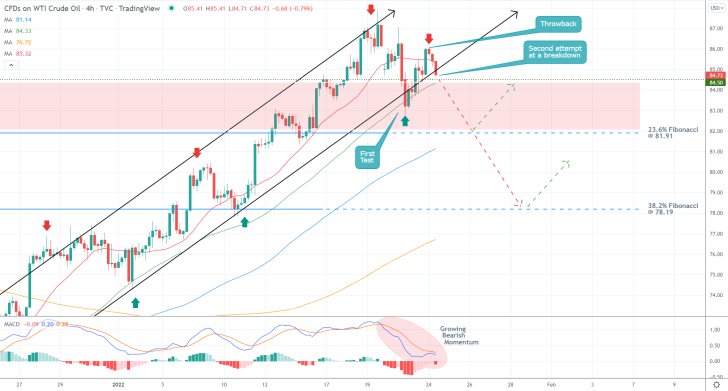
Following the first test of the lower limit of the channel, currently converging with the 50-day MA, a throwback above the 20-day MA ensued. The peak of this throwback is lower than the preceding swing peak, which could represent such an early signal of a new correction. The underlying momentum, too, looks markedly more bearish-oriented given the current reading of the MACD.
The development of such a bearish correction would boil down to whether the price action is able to close below the convergence of the two MAs, the lower limit of the ascending channel and the upper border of the Resistance Area.
It is also worth mentioning that this time, the 100-day MA (in blue) is drawing near the 23.6 per cent Fibonacci, whereas the 200-day MA (in orange) is about to reach the 38.2 per cent Fibonacci. This makes them even more significant bullish thresholds.
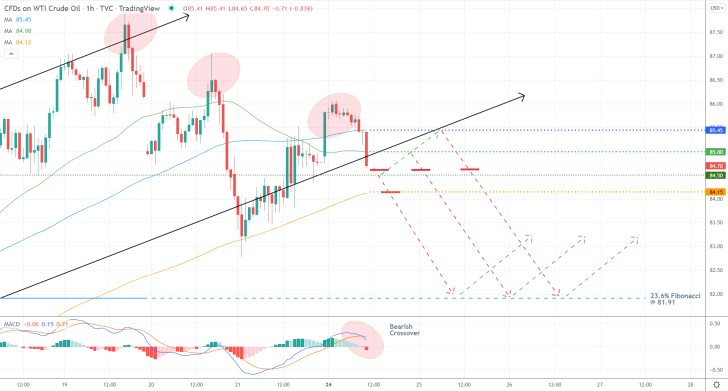
As shown on the hourly chart below, the recent bearish crossover between the 12-day EMA (blue) and 26-day EMA (orange) on the MACD indicator indicates a sharp upsurge in bearish bias over the last several hours. The three consecutively lower swing peaks further confirm this. That is why bears can consider entering short if the price action manages to close below the lower limit of the ascending channel in the next several hours.
Concluding Remarks
Bears can therefore consider placing short market orders around 84.60, though they should be aware of potential pullbacks to the channel from below. That is why their supporting stop-loss orders should not be placed above the minor resistance at 85.00, underpinned by the 50-day MA. They might need several attempts before they gain a favourable entry.
In turn, more risk-averse bears could place short limit orders either at 84.15 or 85.45. In both cases, their SLs should not be placed more than $0.50 away from their initial entries.
Once the price action breaks down below the 23.6 per cent Fibonacci, bears could implement floating TPs in order to squeeze the maximum out of a deeper correction.
A Retest of a Major Resistance Area for Crude Oil
The price action of crude oil is about to test once again the major resistance area just below the psychologically significant threshold at 90.00, which could initiate yet another bearish correction.
The latest upswing to the previous swing peak was initiated in the several hours before the January policy meeting of the Federal Reserve, as traders and investors' anticipation grew. Now that Jerome Powell and his colleagues announced their plans to dial back the quantitative easing programme and possibly lift the Federal Funds Rate as early as March, this anticipation is likely to wane. Hence, the bullish bias would probably drop.
On the one hand, the geopolitical tensions in Ukraine stemming from the prospects of war with Russia keep energy demand high. On the other, the expected strengthening of the dollar in the near future is likely to have an adverse impact on crude oil due to its inverse relationship with the greenback.
That is why bears currently have a chance to implement contrarian trading strategies near the recent swing peak.
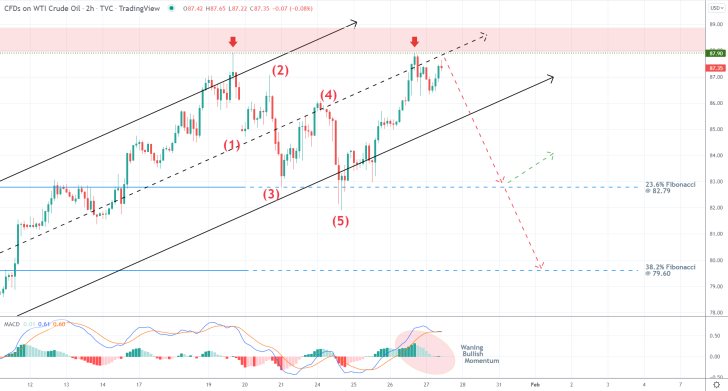
The last bearish correction, as shown on the 4H chart above, took the shape of a 1-5 Elliott impulse wave pattern. The dropdown then rebounded from the 23.6 per cent Fibonacci retracement level at 82.79 and lower limit of the ascending channel.
Now, the price action is retesting the major resistance level at 87.90, which is converging with the middle line of the ascending channel. At the same time, the histogram of the MACD indicator is declining while the 12-day EMA (blue) looks poised to cross below the 26-day EMA (orange), signifying growing bearish bias.
Hence, bears can look for an opportunity to enter short just below the 87.90 threshold. Their supporting stop-loss orders should not be placed higher than 88.40. Due to the likelihood of heightened adverse fluctuations accompanying this reversal, bears might have to place several orders before they gain a favourable entry.
Bears would be able to collect their profits at the 23.6 per cent Fibonacci at 82.79.
Textbook Opportunity for Reversal Play on Crude Oil
The price of crude oil has been consolidating in a range around the previous swing peak at 88.00 over the last several days. And even though a bearish reversal was already projected before, now there is mounting evidence to substantiate these expectations.
The price of crude oil was bolstered by a significant upsurge in buying pressure over the last several weeks due to the geopolitical tensions between Russia and Ukraine. The threat of war exacerbated Europe's brewing energy crisis due to the bloc's energy dependence on Russia. However, the market seems to have already started to discount this risk, which could likely lead to a subsequent uptick in selling pressure.
Moreover, tomorrow's meeting of the European Central Bank is expected to further reassure European investors, as the bank is projected to adopt a more hawkish policy stance. Hence, the underlying set-up looks favourable for the implementation of contrarian trading strategies by bears.
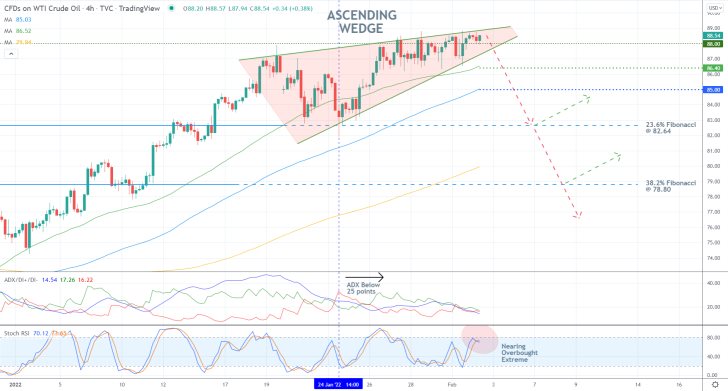
As can be seen on the 4H chart above, the price action has already started to develop a major Ascending Wedge pattern near the resistance at 88.00. The emergence of such a bottleneck around the previous swing peak represents a very substantial indication of a bearish reversal currently in the making.
Additionally, the ADX indicator has been threading below the 25-point benchmark since the 24th of January, while the Stochastic RSI is nearing its overbought extreme. Both factors corroborate the primary expectations.
Bears can look for an opportunity to sell around the upper limit of the Wedge (around 88.60-88.80). Their supporting stop-loss orders should be placed no further than $0.60 above their initial entries.
The first major target would be the 23.6 per cent Fibonacci retracement level at 82.64, though bears should be careful of potential rebounds from the 50-day MA (in green) and 100-day MA (in blue). That is why they could either move their stop-losses to breakeven once the price action penetrates below 86.40 or implement floating TPs after it breaks down below 85.00.
If the price action manages to break both the 23.6 per cent Fibonacci and 200-day MA (in orange), the correction could be extended as low as the 38.2 per cent Fibonacci at 78.80.
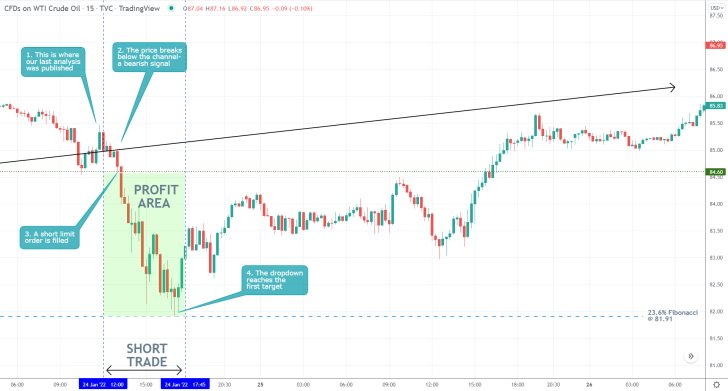
- Our last crude oil analysis successfully captured a breakdown below the lower limit of an ascending channel. Its forecasts for a dropdown to the 23.6 per cent Fibonacci retracement level at 81.91 were also realised.
- Despite this considerable precision, more could have been done to forecast the subsequent bullish rebound.
- Even still, the short trade garnered a profit of nearly 3.20 per cent.
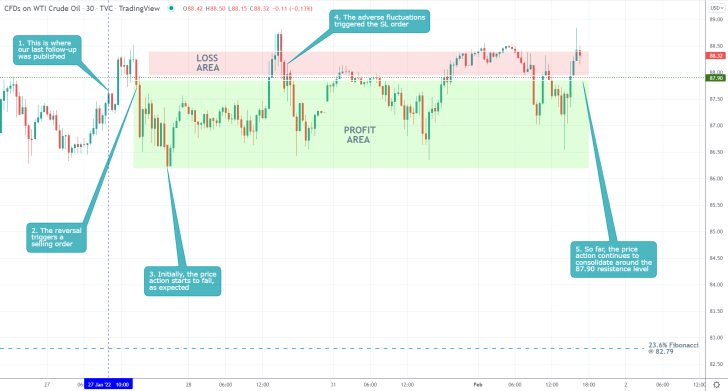
- The expectations of our last follow-up on crude oil for a decisive bearish reversal from the major resistance level at 87.90 were not realised. Instead, the price action went on to consolidate around the level in a narrow range.
- This could still lead to an eventual reversal in the foreseeable future.
- Nevertheless, the adverse fluctuations triggered the stop-loss order of the trade, as the price action was unable to fall to the 23.6 per cent Fibonacci retracement level at 82.79, despite some initial moderate success.
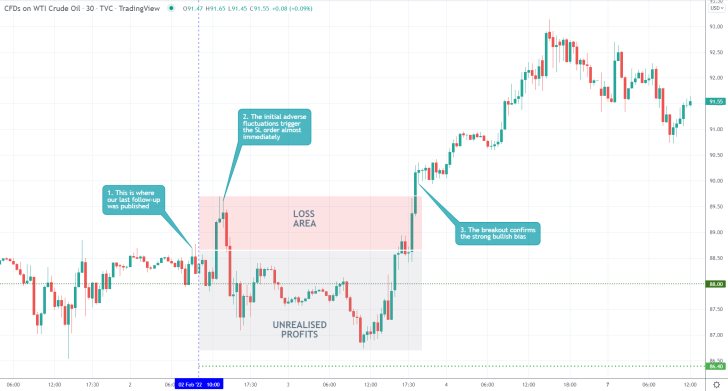
- The expectations of our last crude oil analysis for a bearish reversal from the upper limit of an Ascending Wedge were not realised, which underpins the risk of implementing contrarian trading strategies in a decidedly trending market.
- The adverse fluctuations triggered the supporting stop-loss order almost immediately after the release of the analysis.
Disclaimer: Your capital is at risk! Trading and investing on the financial markets carries a significant risk of loss. Each material, shown on this website, is provided for educational purposes only. A perfect, 100% accurate method of analysis does not exist. If you make a decision to trade or invest, based on the information from this website, you will be doing it at your own risk. Under no circumstances is Trendsharks responsible for any capital losses or damages you might suffer, while using the company’s products and services. For more information read our Terms & Conditions and Risk Disclaimer.


