The energy market has benefited greatly by heightened demand amidst accelerating global recovery. This has prompted a massive bullish rally on the price of crude oil, which reached the psychologically significant resistance level at 70.00.
Nevertheless, the latter represents a prominent turning point, which is why the emergence of a new bearish correction from it in the short term seems highly plausible. Such a correction is unlikely to terminate the underlying trend, which was supported recently in the wake of the latest OPEC meeting.
The latest inflation data in the U.S., which is scheduled for publication on Thursday will likely serve as a catalyst for such a dropdown. According to the preliminary forecasts, consumer prices are likely to drop by half from a month prior, which would underpin a momentary drop in aggregate demand. This would consequently be reflected on the price of crude as energy demand decreases in the short term.
Falling Bullish Pressure
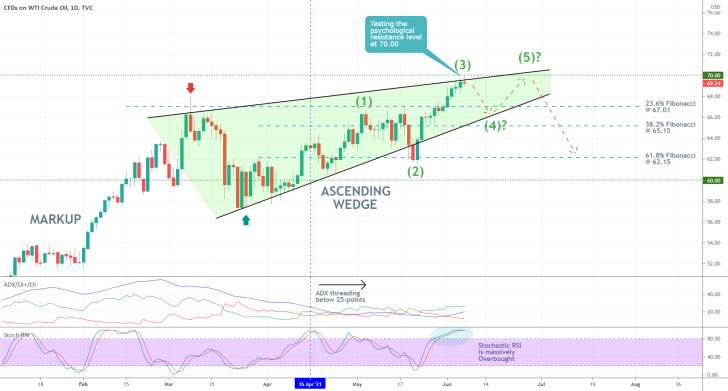
Bullish commitment in the market is already falling, as demonstrated by the emergence of a massive Ascending Wedge pattern on the daily chart below. This type of pattern is typically taken to signify likely bearish reversals, which is inlined with the primary expectations.
This is especially true given the apparent convergence of the Wedge's upper boundary with the psychological resistance at 70.00. Moreover, the behaviour of the price action within the limits of the Wedge is taking the form of a 1-5 impulse wave pattern, as postulated by the Elliott Wave Theory.
The timing thus seems perfect for the development of the second retracement leg (3-4), now that the price is threading below the upper boundary of the Wedge and the 70.00 resistance. Such a correction is likely to fall to the lower end of the Wedge, which is converging towards the 23.6 per cent Fibonacci retracement level at 67.01.
The primary focus of this analysis is centred on the expectations for such a dropdown. A more sizable downtrend could emerge in the longer term; however, it would take much more bearish commitment in the market.
After the price bottoms out at 4, it is likely to go on developing the final impulse leg (4-5). The latter could even break out above the psychological resistance level momentarily before a more sizable bearish reversal takes place.
Notice that the ADX indicator has been threading below the 25-point benchmark since the 16th of April, which confirms the range-trading sentiment in the market that is currently prevailing. This is ideal for the execution of contrarian trading strategies, including on the expectations for a correction.
Finally, the Stochastic RSI indicator has been threading in its overbought extreme for quite a while now, which, given the raging environment, is also extremely likely to prompt the resurgence of selling pressure in the short term. Overall, there seems to be a definite confluence of mounting bearish signals in the short term.
The Reversal in the Making
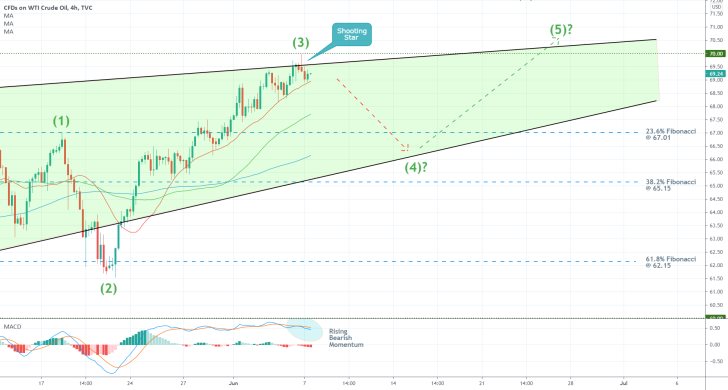
The 4H chart below highlights the latest top at point 3. Immediately after the price touched the 70.00 benchmark, it went on to change directions yet again, leaving in its wake a Shooting Star candle. Such candles signify mounting bearish bias towards the end of an existing uptrend, which is to be expected before the emergence of a new correction.
A likely trigger for the beginning of such a dropdown would be a breakdown below the 20-day MA (in red), which is the closest floating support to the current market price. Bears should watch the behaviour of the price around the other two moving averages - the 50-day MA (in green) and the 100-day MA (in blue) - as both of them could initiate snap bullish rebounds.
At any rate, bearish momentum appears to be rising in the short term as well, as demonstrated by the MACD indicator.
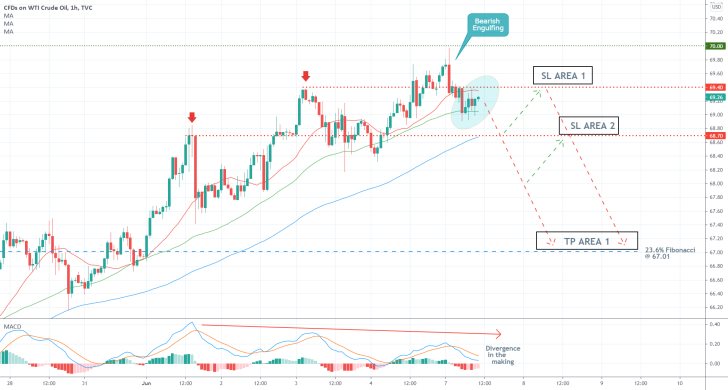
There are several key developments that bears need to watch for in the very short term. The aforementioned Shooting Star candle takes the form of a Bearish Engulfing on the hourly chart below. It closed below the latest swing high at 69.40, which could be used as a reference point for placing a stop-loss order.
Notice that on this timeframe, the MACD indicator is illustrating a Divergence in the making, which highlights the accelerating bearish bias in the very short term.
Meanwhile, the price action is presently consolidating between the 50-day MA and the 20-day MA, as well as below the support-turned-resistance at 69.40. A breakdown below this minor range, underscored by the blue ellipse, would signify the likely beginning of the new bearish correction.
Concluding Remarks:
Bears looking to sell around the spot price should consider placing their first stop loss just above the aforementioned swing peak at 69.40. Once the price action manages to break down below the next support at 68.70 (its significance is derived from the fact that it pinpointed the preceding swing peak), bears would be able to move their stop-losses.
This support level is currently being crossed by the 100-day MA, so a decisive breakdown below it would allow bears to move their stop-losses to the second SL area.
As stated earlier, the 23.6 per cent Fibonacci retracement level at 67.01 signifies the first major target for such a correction. Bears are advised against trying to catch a much bigger dropdown below it, as the market is not yet ready to establish a complete trend reversal.
Is it Time for a Correction on Crude Oil?
The price of crude oil continues to be rallying as global demand increases. This is owing to the robust growth in economic activity. The recent breakout above the psychologically significant resistance level at 70.00 represents yet another crucial stepping stone in the underlying rally.
However, with the penetration above this threshold, bullish momentum may be due for a temporary respite. If realised, this would clear the way for a minor correction towards one of the closest supports. Is it, therefore, time to consider selling the commodity?
This week's economic calendar would likely favour a dollar strengthening, which, consequently, could ease some of the bullish pressure currently exerted on the price of crude. Hence, market factors are becoming increasingly more bearish-looking; however, is this going to be enough to jolt the rally of WTI momentarily?
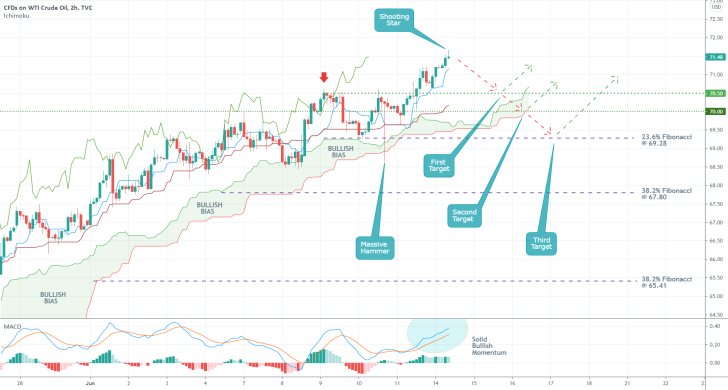
As can be seen on the 4H chart above, the broader market sentiment remains ostensibly bullish. This is underpinned by the Ichimoku Cloud indicator. Nevertheless, this does not preclude the possibility for a momentary dropdown towards the Cloud itself.
As stated earlier, the price broke out above the psychological resistance at 70.00 very recently, which in itself is likely to prompt a corrective downswing to the new support from above. The emergence of a Shooting Star candle, which typically entails rising selling pressure when found at a recent swing peak further confirms this.
If the price manages to break down below the 10-day MA in blue (the conversion line of the Ichimoku Cloud), then it would potentially be able to fall towards 70.50 - the first target for a new correction. The significance of this resistance-turned-support stems from the fact that it had previously served the role of a swing peak.
The second and most likely target is underpinned by the 70.00 psychological support, which converges with the lower limit of the Cloud. If, however, the correction turns out to be even deeper than that, the price of crude could fall as low as the 23.6 per cent Fibonacci retracement level at 69.28 before it finds the necessary support to consolidate there.
Less risk-averse traders could sell right away, but they need to place very tight stop-losses just above the latest peak. More risk-averse bears could instead wait for a bearish crossover on the MACD (the 12-day EMA crossing below the 260-day EMA) before they enter into a trade.
Crude Oil Likely to Test New Historic Peaks
The price of crude oil was unsurprisingly affected by last week's tribulations. In particular, the highly anticipated FED meeting caused commodities to sink as dollar bulls rallied. This resulted in the establishment of a bearish correction on the price of crude in an otherwise strong bullish market.
Nevertheless, this is likely to be a short-lived disturbance in the broader uptrend, as global demand for the commodity remains substantial. It is being fuelled by recuperating global activity. This week's top-tier economic events are likely to bolster this trend.
This creates a good environment for implementing trend continuation trading strategies on the expectations for continued price appreciation in the near future.
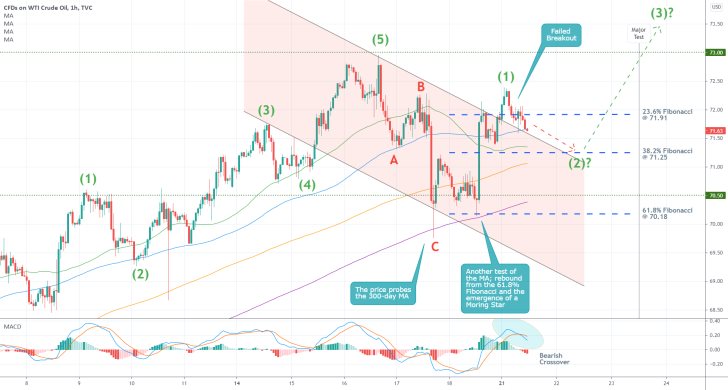
As can be seen on the 4H chart above, the price of WTI established a corrective ABC pattern following the completion of a 1-5 impulse wave pattern, as postulated by the Elliott Wave Theory. This confirms the abovementioned expectations for sustained price appreciation, potentially in another 1-5 pattern.
Notice that in addition to rebounding from the crucial resistance-turned-support level at 70.50, last week's dropdown was also checked by the 61.8 per cent Fibonacci retracement, the 300-day MA (in purple), and the lower boundary of the descending channel.
All of this signifies that the correction found very strong bullish support around 70.50. The resulting Morning Star pattern implies that the price is now most likely done falling (below 70.50). Nevertheless, this does not preclude the possibility for a smaller dropdown before the broader uptrend is fully resumed.
The price could fall to the 38.2 per cent Fibonacci retracement level at 71.25 before this happens. The latter is currently converging with the 50-day MA (in green) and the channel's upper boundary, making it a viable target for the (1-2) retracement leg. The bearish crossover on the MACD indicator highlights this changing market bias in the short term.
Bulls can look for an opportunity to go long around 71.25 on the condition that the bearish correction bottoms out above the 200-day MA (in orange). The next impulse leg (2-3) is likely to attempt penetrating above the previous swing peak (at 73.00). Even still, the psychological significance of the latter should not be neglected. That is why another bearish reversal could occur from it.
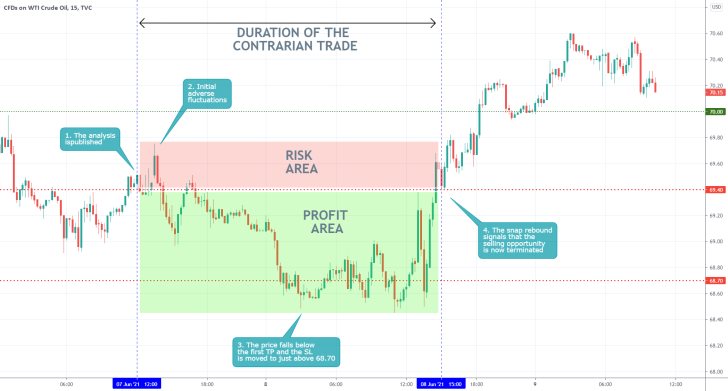
- The price of crude fell to the first take profit level at 68.70, as was projected by the initial analysis. However, the downtrend was not extended any lower, and the price went on to rebound from that level.
- The above setup represents a good example of why traders need to monitor the development of their trades and move their STs and TPs as the market goes in their anticipated direction.
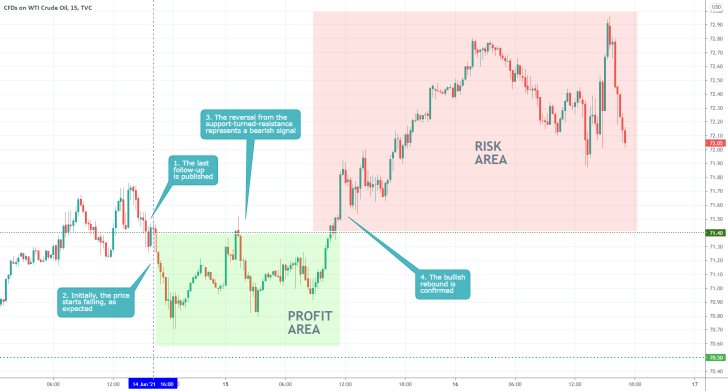
- The price of crude oil initially started to fall, as forecasted by our last follow-up analysis, but then it rebounded sharply. There are several crucial conclusions that can be derived here.
- Firstly, not even when there is a confluence of underlying indications can something be confirmed with certainty. The price did reverse from the support-turned-resistance at 71.40, which represents a major bearish confirmation. Yet, this did not prevent the sharp rebound that followed next.
- Secondly, seeking to sell just because the price is trading at a multi-year high (or buy at a multi-year low) is not a strategy that can be justified on its own. The price could always drill deeper or rise higher, regardless of its current relation to historic movements. This is one of the risks of using contrarian trading strategies.
- Finally, technical traders should recognise it when the price is being driven mostly by external factors. With regards to crude, its price action has been mostly determined by the latest inflation concerns.
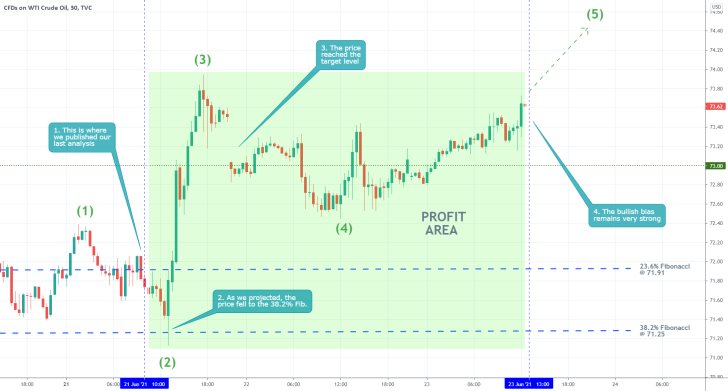
- Our last analysis of crude oil proved to be quite successful. It projected the initial dropdown to the 38.2 per cent Fibonacci retracement level at 71.25, followed by a subsequent upswing past the resistance level at 73.00.
- The trade was executed quite well, which is why there is not much more that needs to be said.
- The underlying bullish sentiment remains, which could support further price appreciation.
Disclaimer: Your capital is at risk! Trading and investing on the financial markets carries a significant risk of loss. Each material, shown on this website, is provided for educational purposes only. A perfect, 100% accurate method of analysis does not exist. If you make a decision to trade or invest, based on the information from this website, you will be doing it at your own risk. Under no circumstances is Trendsharks responsible for any capital losses or damages you might suffer, while using the company’s products and services. For more information read our Terms & Conditions and Risk Disclaimer.


