The long-anticipated reversal on the price of crude oil may finally be on the horizon, given the latest developments on the price action of the commodity. However, right off the gate, it should be stated that the ongoing energy crisis continues to be the biggest determinant of the heightened demand for gas, which has a spillover effect over crude oil as well.
That is why bears should be especially cautious when they place their selling orders. The timing of the trade would depend on whether the market has already priced in the global energy developments and whether the risk of additional adverse fluctuations persists.
The U.S. advance GDP growth report, which is scheduled for publication later today, could likely be the catalyst of the next directional price swing. According to the preliminary forecasts, the pace of economic expansion in the States is expected to decline sizably from a quarter prior.
Crunching aggregate demand would also underpin falling energy demand in the U.S., which, in turn, would likely have a negative impact on the price of crude. This would be inlined with the recently observed economic tendencies in China, the world's fastest-growing economy.
The robust earnings season in the U.S. represents the last factor worth examining that could prompt a crude oil selloff. Heightened investors' demand for stocks would likely have a positive impact on the value of the dollar, which has a negative relationship with the price of crude. In other words, a greenback recovery would potentially bolster the selling pressure on crude oil.
Early Bearish Indications
The latest uptrend is represented as an ascending regression channel on the daily chart below. Notice that the market had technically started trending on the 15th of October when the ADX indicator broke above the 25-point mark. This means that the underlying conditions are still more or less neutral, which corroborates the expectations for a likely bearish reversal.
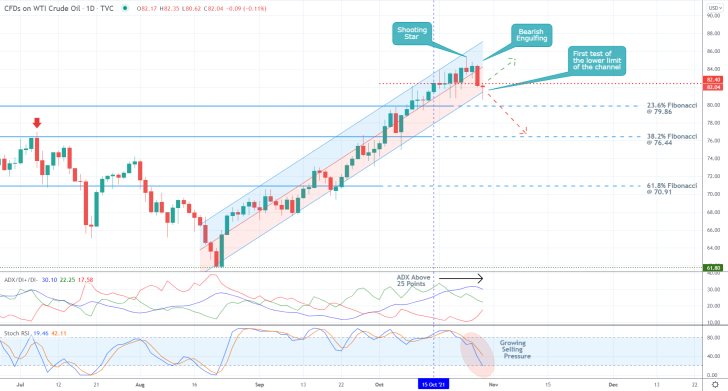
The price action has been consolidating around the 82.40 resistance-turned-support level since the 15th of October, elucidated by the accumulation of multiple candlesticks with big tails and small bodes, which can be seen as a discrepancy with the current reading of the ADX. Such mounting uncertainty could also be a probable early indication of an upcoming reversal. Especially since selling pressure keeps growing, as demonstrated by the Stochastic RSI indicator.
The first such indication was the emergence of a Shooting Star candlestick at the top of the uptrend. It was then followed by a Bearish Engulfing candle, which underpins a sharp uptick in bearish bias. The latter closed below the middle line of the regression channel, and today's price action probed its lower limit for the first time in quite a while.
While some adverse fluctuations to the swing peak of the uptrend are still quite possible, the new downtrend's first major test would be to penetrate below the 23.6 per cent Fibonacci retracement level at 79.86. Notice that it is positioned especially close to the psychologically significant support at 80.00, making it a probable turning point.
If the price action manages to break down below this psychological threshold decisively, the next target for the downtrend would be the 38.2 per cent Fibonacci at 76.44. Notice that the latter marks the swing peak of the previous bullish trend. This makes it a very prominent turning point as well.
The Emergence of a Head and Shoulders Pattern
As can be seen on the 4H chart below, the reversal is likely to take the form of a Head and Shoulders Pattern. Today's rebound of the price action from the 100-day MA (in blue) marks the likely beginning of the development of the Right Shoulder. The 100-day MA is currently converging with the Neckline (area) of the H&S, which spans between the major support at 81.50 and the major resistance at 82.00.
The current pullback representing the Right Shoulder is therefore likely to peak just above the 83.10 resistance area, which is underpinned by the 250-day MA (in green). The 20-day MA (in red) is also drawing near this resistance, which is likely to make it an even more significant turning point. This is where bears can start looking for an opportunity to enter short.
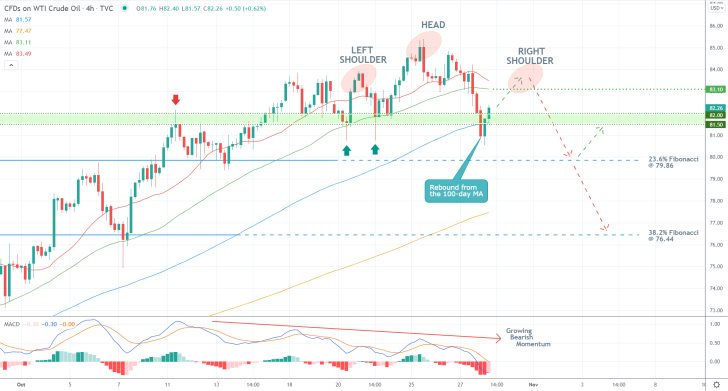
Bears should continue observing the development of the current pullback and wait for its completion. The emergence of such a temporary pullback while the underlying momentum is becoming increasingly more bearish-looking, as underscored by the MACD indicator, signifies a divergence in the making. This also corroborates the expectations of a substantial reversal in the near future.
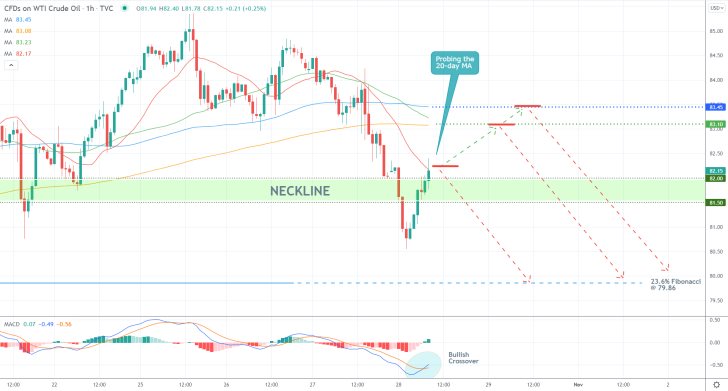
Regarding the price action's behaviour in the very short term, a minor bearish crossover was recorded by the MACD over the last couple of hours, as shown on the chart below. This entails the strength of the pullback.
The first, albeit least likely, turning point could occur around the current spot price. A potential reversal from the 20-day MA would entail this. And if the price action breaks out above it, it would then very likely head towards the aforementioned resistance at 83.10.
Notice that the latter is currently converging with the 200-day MA (in orange) and the 50-day MA (in green). Finally, the reversal could occur from the major resistance level at 83.45, which is underpinned by the 100-day MA (in blue).
Concluding Remarks
Bears looking to sell around the current spot price should keep in mind that this would be very risky. That is why they should place their supporting stop-loss orders no more than 0.70 above the 20-day MA (as seen on the hourly chart). More risk-averse bears can place short limit orders around the 81.10 resistance level, with supporting stop-losses just above 83.45.
The first target for both would be the 23.6 per cent Fibonacci at 79.86, as stated earlier. Once the price action draws close to it, they could substitute their fixed stop orders for floating TPs in order to squeeze the maximum out of a potential dropdown towards the 38.2 per cent Fibonacci.
Crude Oil Attempting to Break Down Below the Distribution Range
The price action of crude oil has been consolidating within a major Distribution range, as postulated by the Wyckoff cycle theory, over the past several days. The range is situated at the top of the recent rally. As per the expectations of the Wyckoff model, a decisive breakdown below the Distribution would entail the likely beginning of a new downtrend (Markdown).
The price action recovered some of its recent losses yesterday following the November policy meeting of the Federal Reserve. The Federal Open Market Committee (FOMC) expectedly decided to commence tapering its asset purchasing (quantitative easing) programmes starting next month.
The reason for the sudden jump was mainly attributed to FED's take on the solid economic recovery in the U.S., which is partly predicated on heightened energy demand. However, the longer-term consequences of the decision are likely to be less favourable for the price of the commodity. By dialling back the pace of its asset purchase facility, the FED would be providing fewer incentives for businesses to use the flow of easy liquidity, which could therefore stave off some of the demand for crude.
In other words, the current fundamentals seem to be inlined with the expectations for sustained price depreciation over the next following weeks and months. Bears can therefore wait for the current pullback to reach a fresh peak before they utilise contrarian trading strategies on the expectations for the emergence of a new Markdown from the current Distribution range.
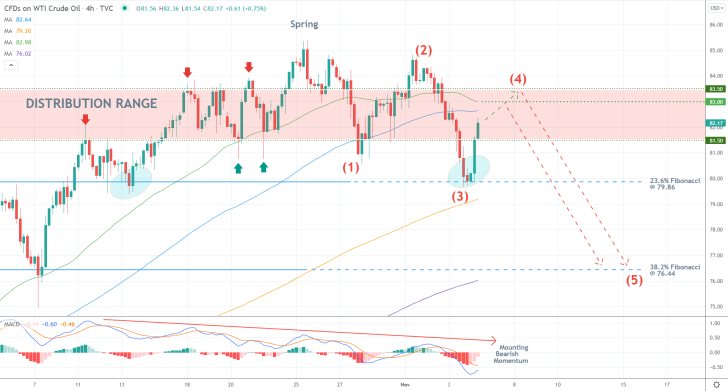
As can be seen on the 4H chart above, the Distribution range spans between the major support level at 81.50 and the major resistance at 83.50. So far, the behaviour of the price action within the boundaries of the range has been congruent with a likely trend reversal currently in the making. This is signified by the development of false breakdowns and the emergence of a spring (fakeout).
Notice that the aforementioned pullback is actually the second retracement leg (3-4) of a newly emerging 1-5 impulse wave pattern, as postulated by the Elliott Wave Theory. What is so intriguing about this retracement leg is that it emerged from the 23.6 per cent Fibonacci retracement level at 79.86, which is positioned just below the psychologically significant resistance-turned-support at 80.00. This is expected since it was the first test of this level's newly adopted role as a prominent support.
The currently developing trend reversal is likely to continue being typified by such adverse fluctuations around the Distribution range as bearish pressure keeps increasing. This divergence is underpinned by the MACD indicator.
Bears can look for an opportunity to sell either around the crossover between the 50-day MA (in green) and the 100-day MA (in blue) - currently at 83.50 - or the upper limit of the Distribution range. In either case, their stop-loss orders should not exceed $0.50.
The first target would be the 23.6 per cent Fibonacci, which is about to converge with the 200-day MA (in orange). This would make it an even more prominent threshold. If the price action manages to break down below the two, the next target would be the 38.2 per cent Fibonacci at 76.44.
New Chance for Crude to Break the Distribution Range
The price of crude oil continues to be consolidating within the boundaries of a major Distribution range, as postulated by the Wyckoff Cycle theory. Typically, Distribution ranges are perceived as transitionary stages, as the market terminates an existing uptrend and prepares for the formation of a new downtrend.
This transition is usually epitomised by heightened volatility as the price fluctuates around the range's two extremes. That is why traders might have to execute several orders before they catch the beginning of the new downtrend.
Following a recent fakedown below the lower limit of the Distribution, which was forecasted by our previous follow-up, the price rebounded back to the range's upper limit yesterday. This was prompted by the latest production inflation numbers in the U.S., which signified heightened demand.
Once the market prices in today's consumer prices data as well, the price of crude would finally be ready to start depreciating. That is why bears should be careful when they utilise contrarian trading strategies near the current peak.
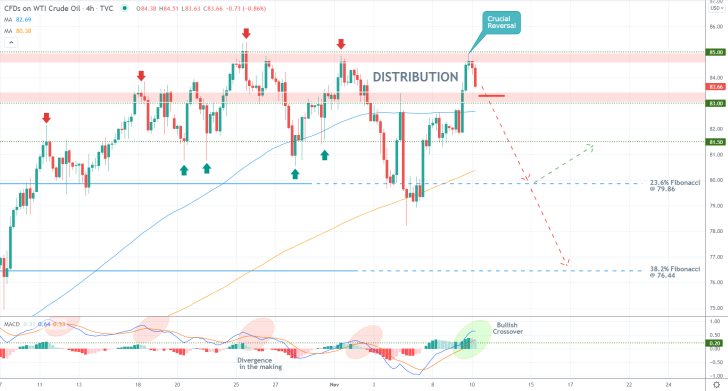
As can be seen on the 4H chart above, the Distribution range spans between the major support level at 83.00 and the major resistance at 95.00. Given that the price action has just reversed from the latter, bears can immediately look for an opportunity to enter short around the current spot price.
However, they should keep in mind that the 100-day MA (in blue) is about to converge with the lower boundary of the range, thereby making it an even more powerful support. Meanwhile, the 200-day MA (in orange) has just crossed above the 23.6 per cent Fibonacci retracement level at 79.86, which is positioned just below the psychological threshold at 80.00. All of this makes this area an even more prominent turning point.
Bears should also consider the fact that the underlying bullish momentum is on the rise. The MACD is no longer underpinning a divergence in the making, demonstrated by the recent breakout of the two EMAs past the 0.20 benchmark. This makes a potential entry at the current spot riskier.
At any rate, bears choosing to enter now should place narrow stop-losses that do not exceed $0.60 from their initial entries. Their first target would be the resistance-turned-support at 81.50. If the price manages to break down below it, the next target would be the 23.6 per cent Fibonacci.
This is where the last rebound occurred from. Once the price draws near to it, bears could substitute their fixed stop orders for floating TPs in order to catch the maximum out of a potential breakdown below this threshold.
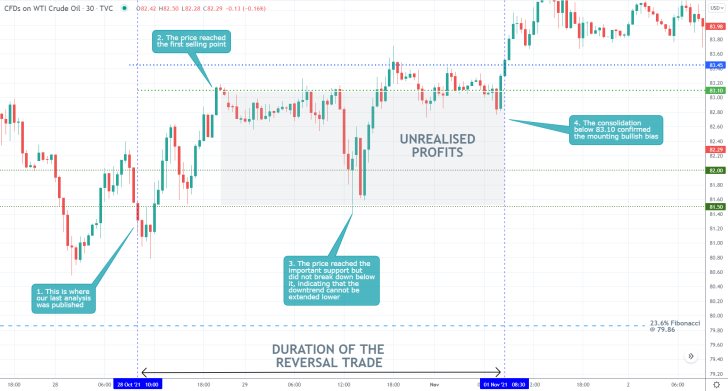
- The forecasts of our newest crude oil analysis did not pan out exactly but this was not detrimental to the overall performance of the trade. As soon as the price action reached the first entry point, a short order was executed.
- There was some initial success but the snap rebound from the 81.50 support level demonstrated that the reversal would not be extended lower.
- This is a good example of why it is prudent to move your stop-loss orders to breakeven once the price action has moved by a significant margin in your anticipated direction.
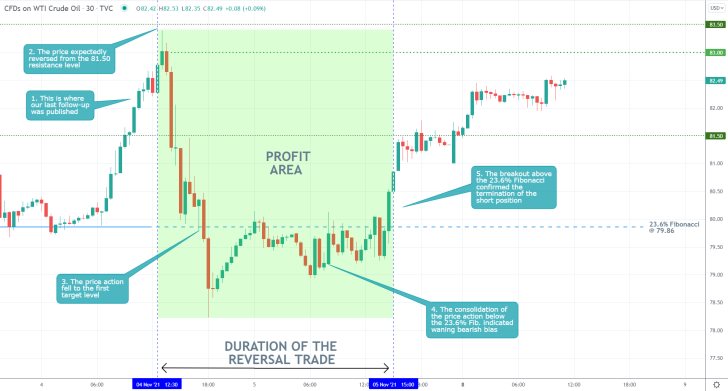
- The forecasts of our last analysis of crude oil were quite accurate in predicting a bearish reversal from the major resistance level at 83.50. The subsequent dropdown expectedly reached the 23.6 per cent Fibonacci retracement level at 79.86.
- Overall, the trade caught more than $3.50 (4.23 per cent) from the downswing.
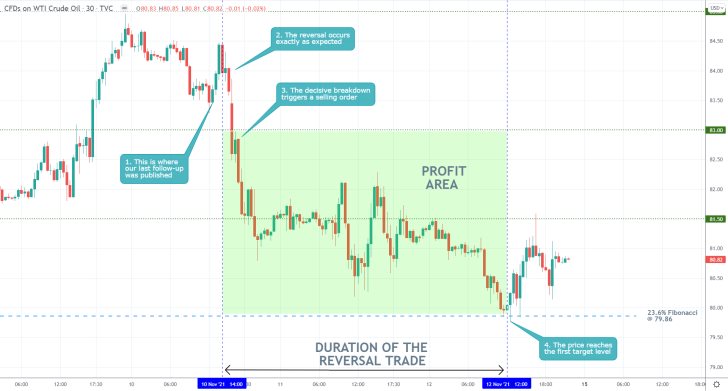
- Our previous follow-up analysis of crude oil was massively successful. It quite accurately forecasted a bearish reversal from the Distribution range, followed by a decisive breakdown below the range's lower limit at 83.00.
- The price action then dropped to the 23.6 per cent Fibonacci retracement level at 79.86, as was forecasted.
- This setup was exemplary in utilising contrarian trading strategies in the expectations for the development of a new trend.
Disclaimer: Your capital is at risk! Trading and investing on the financial markets carries a significant risk of loss. Each material, shown on this website, is provided for educational purposes only. A perfect, 100% accurate method of analysis does not exist. If you make a decision to trade or invest, based on the information from this website, you will be doing it at your own risk. Under no circumstances is Trendsharks responsible for any capital losses or damages you might suffer, while using the company’s products and services. For more information read our Terms & Conditions and Risk Disclaimer.


