The price of WTI continues to trade around the psychologically significant resistance level at 60.00 in anticipation of another directional movement. Following the completion of a massive bullish uptrend recently, the commodity's price has begun to consolidate as bearish pressure ramps up. This can potentially be perceived as the early stage in the development of a new downtrend, provided that the bears manage to drive the price below 60.00 decisively.
This week's U.S. inflationary data for the month of March is going to be the key catalyst for crude's future price action, as it could drive oil significantly lower. The consensus forecasts anticipate headline inflation in the U.S. to surge by another 0.5 per cent, which would see it surpassing FED's longer-term target level of 2.0 per cent.
Rapidly rising prices are already raising concerns amongst investors who fear the possibility of a new debt bubble. The Federal Reserve may thus be compelled to rethink its massively accommodative policy stance sooner than initially expected, which, in turn, is likely to affect aggregate demand, thereby bolstering the selling pressure on the price of crude.
This process has already begun to unfold. The end of crude's last bullish trend was brought about shortly following the publication of the last CPI report, which underpinned the rapidly increasing production costs in the U.S. Thereby, the latest CPI report, which is scheduled for release on Tuesday, is likely to exacerbate the selling pressure on crude oil as headline inflation continues to increase.
1. Long-Term Outlook:
As can be seen on the daily chart below, the price of WTI has recently developed a Distribution range, as per the expectations of the Wyckoff Cycle theory. The Distribution range represents an intermediate stage, separating an established bullish trend (Markup) from a potential downtrend (Markdown). The Distribution is the exact opposite of an Accumulation range.
The lower boundary of the Distribution is encapsulated by the aforementioned psychological resistance at 60.00. It can be seen that the price action has already broken down below the latter, which confirms the expectations for further price depreciation in the short term.
Notice also that the 23.6 per cent Fibonacci retracement level at 52.01, which bears psychological significance as well, is situated roughly at the mid-point between the Distribution and the last Accumulation. The latter's upper boundary is represented by the 38.2 per cent Fibonacci retracement level at 42.06. This makes the 23.6 per cent Fibonacci the first major target for a newly emerging downtrend.
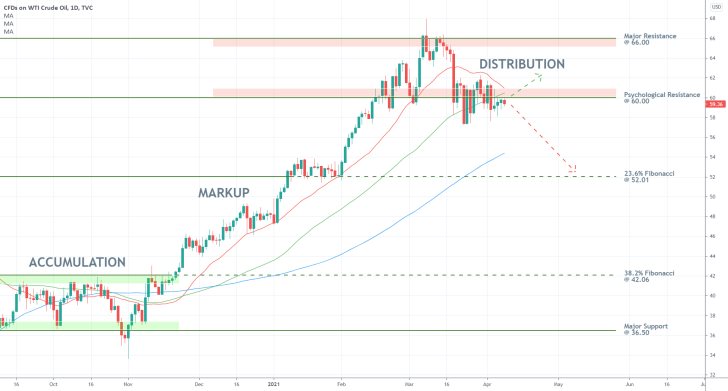
It is also interesting to point out that the price of crude oil is currently consolidating not only below 60.00 but also below the 50-day MA (in green), which is converging with the 20-day MA (in red). This behaviour of the price action underpins the aforementioned consolidation, encapsulating the interim moment before the downtrend can resume developing.
In other words, the expectations for further price depreciation will remain prevalent for as long as the price action remains concentrated below the two moving averages and the psychological resistance. Meanwhile, the 100-day MA (in blue) serves the role of a floating support, which should not be neglected by bears. Before the price can drop to 52.01, it would have to penetrate below the 100-day MA.
2. Short-Term Outlook:
Distributions are synonymous with range-trading, which is why traders should brace for adverse fluctuations for as long as the price remains concentrated within the boundaries of one. Given the close proximity of crude's current price to the upper boundary of the Distribution underpins the threat of such adverse fluctuations.
In order to mitigate the risk of such adverse fluctuations while preparing the execution of a short order, bears need to observe the Pennant pattern on the 4H chart below. Given the previous downswing from the Distribution's upper boundary, the emergence of the Pennant encapsulates a temporary consolidation before the price can resume falling.
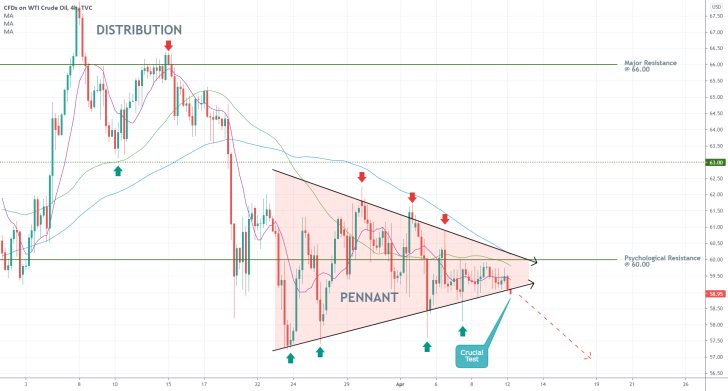
The tightening boundaries of the Pennant represent a bottleneck, which can shed light on when the price is likely to break down below it decidedly. In other words, the narrower that the Pennant gets, the likelier it becomes for the consolidation stage to be terminated. Furthermore, bears can perceive any dropdown below the Pennant's lower boundary as a definite sign of mounting bearish pressure.
Notice that the three moving averages - the 100-day MA (in blue), the 50-day MA (in green), and the 10-day MA (in purple) - form a perfect descending order. For as long as the price action remains concentrated below the three, the bears can anticipate the bearish pressure in the short-term to persist.
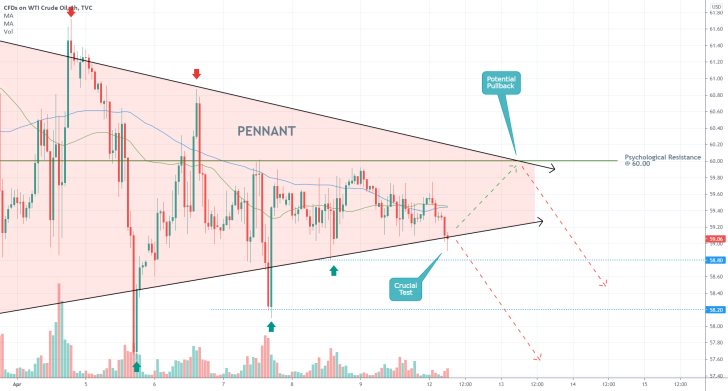
The hourly chart below examines the currently emerging bottleneck in greater detail. The underlying trading volume has been falling steadily over the last several days, which is to be expected the longer that the price action remains consolidating. This diminished trading volume is what makes it more likely for the emergence of adverse fluctuations.
Market bears should keep in mind that while most factors seem to point to future price depreciation, this does not preclude the possibility for yet another pullback towards the psychological resistance. The latter is currently being crossed by the Pennant's upper border, which makes it an even more prominent resistance.
3. Concluding Remarks:
The 58.80 level, which served as the latest swing low, underpins what would constitute a decisive breakdown below the Pennant. More risk-averse traders wanting to hedge against the possibility of a pullback to 60.00 can wait for the price to penetrate below 58.80 before they place their short orders.
As stated earlier, the 23.6 per cent Fibonacci retracement level at 52.01 serves as the first major goal for the new Markdown. Meanwhile, the minor support at 58.20 constitutes its first obstacle.
Finally, bears should not underestimate the possibility of additional price fluctuations. The likelihood of a pullback as far as the 20-day MA (as seen on the daily chart) remains present, which is something that they need to consider carefully when placing their stop-loss orders.
Robust Global Demand Drives Crude Oil Higher
The price of crude oil has advanced by nearly 5 per cent over the past several days as the global economy continues to recuperate. Earlier today, it was revealed that China's economic output has surged sharply by 18.3 per cent in the first quarter of the year, which constitutes the biggest quarterly advance on record.
Demand is rising globally as businesses reopen, even though this is happening unevenly. This trend is likely to continue supporting crude's rally in the upcoming weeks, as the price recouped from the recent bearish correction.
An attestation to crude's robust bullish sentiment is represented by the soaring inflationary pressures in the U.S. The price of the commodity is likely to continue climbing north in the near future, which allows for the implementation of trend continuation trading strategies.
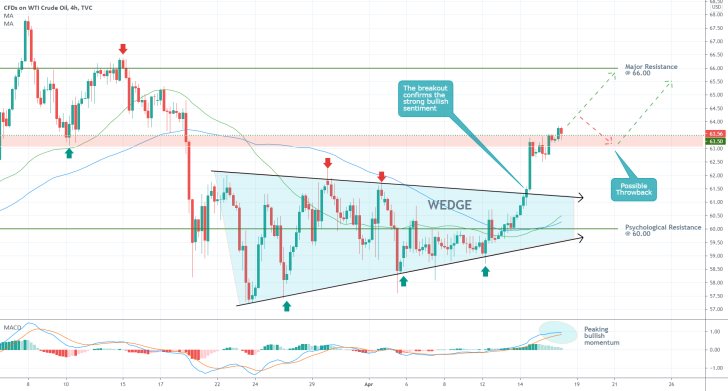
As can be seen on the 4H chart above, the price of crude oil has recently broken out above the consolidation Wedge's upper boundary. This underpins the reinvigorated buying pressure in the short term. Even though the commodity flirted with the psychologically significant support level at 60.00 for a little while, the subsequent rebound confirmed that the bears are incapable of invalidating the existing rally at the present moment.
The 50-day MA (in green) crossed above the 100-day MA (in blue), which is substantiating the significance of these observations. Moreover, the price managed to break out above the previous swing low at 63.50. It is now in a very favourable place to attempt consolidating above this resistance-turned-support. The area in red thus underpins the risk of adverse fluctuations as this strengthening takes place.
In other words, bulls looking to join the reinvigorated uptrend should be cautious of possible pullbacks to the lower boundary of the area. On the other hand, such pullbacks would allow them to add to their existing positions by means of going long at the resulting dip. This is ideal for traders looking to practice longer-term position trading.
The next target for the rally is underpinned by the major resistance level at 66.00, whose prominence stems from the fact that it managed to contain the last swing high. Finally, bulls should keep an eye on the MACD indicator, which is underscoring peaking bullish momentum. This could lead to prolonged price consolidation over the next several days as crude gets ready to resume climbing higher.
WTI is Consolidating Within a New Range
The price of crude oil (WTI) is currently consolidating in a new range, which signifies the complete termination of the preceding uptrend. This could also be perceived as an intermediate stage in the development of a new bearish downtrend. This happens as underlying selling pressure keeps increasing gradually.
As regards the current fundamental outlook, there are plenty of reasons to anticipate discrepancies in WTI demand in the near future. This is owing to the fact that the earnings season keeps going, which is diminishing investors' interest in the commodities market.
On the other hand, this week's GDP data in the U.S. is likely to underpin growing economic activity, which would represent good news for aggregate demand. As a whole, WTI is expected to experience heightened demand in the immediate future, which is then set to diminish. Hence, the expected dropdown in the price could start taking place after several days.
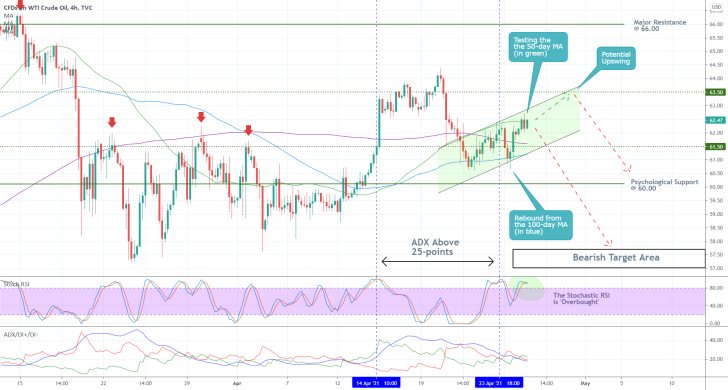
As regards the current technical outlook, the price of WTI is in the process of establishing a minor bullish channel, as shown on the 4H chart above. This channel encapsulates the aforementioned emergence of a new consolidation range.
Notice that the ascending channel (Flag) is currently contained within the 50-day MA (in green) and the 100-day MA (in blue), which underscores the temporary consolidation of the price action. This could be extended as high as the major resistance level at 63.50 before the underlying bullish commitment is exhausted completely. However, a bearish reversal could emerge much sooner than that.
The ADX indicator fell below the pivotal 25-point benchmark on the 23rd of April, which confirms the range-trading environment. Moreover, the Stochastic RSI indicator is currently threading in its overbought extreme, which signals a potential bearish reversal because of the muted market pressures.
Once again, the bearish reversal is likely to start developing anywhere between the current market price and the major resistance level at 63.50. If it manages to break down below the major support level at 61.50, whose significance as a potential turning point stems from the fact that it is currently converging with the 200-day MA (in purple), then the downtrend would be able to test the psychologically significant support level at 60.00.
The Bearish Target Area spanning between 57.00 and 57.70 encompasses the longer-term goals for such a downtrend.
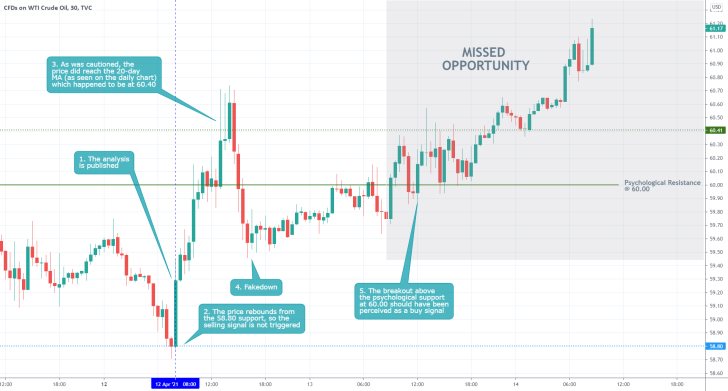
- Shortly after the publication of the last crude oil analysis, the price of the commodity fell to the underpinned support level at 58.80. The consolidation above it meant that the selling opportunity was not realised.
- The analysis' warning of potential adverse fluctuations prevented any losses; however, the analysis failed to demonstrate how the subsequent bullish upswing could have been traded.
- When things don`t go the way you expected them to, you have to be able to recognise the new evidence as it comes. Don`t stick to old perceptions based on even older evidence that is no longer relevant.
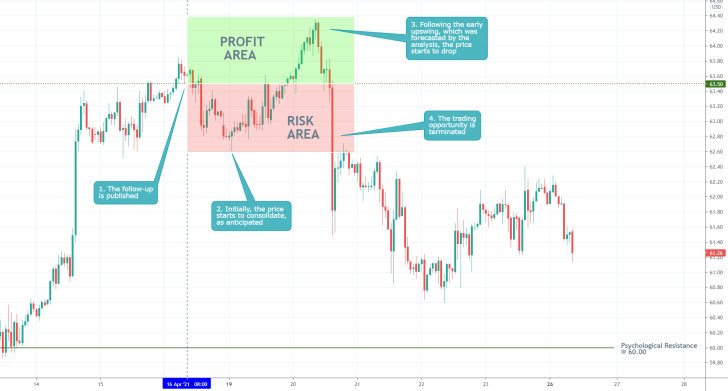
- Despite some moderate success, the analysis as a whole failed to capture the eventual bearish reversal. That is so because at the time of writing, the market hadn`t started to price in the recent change in global demand yet. Chiefly, the strengthening of the U.S. dollar against the weakening of more volatile assets, such as Bitcoin.
- Traders need to remember that joining an existing trend always bears the risk of sudden reversals. That is why trend continuation strategies are best utilised at the dips/bottoms of minor corrections within broader uptrends/downtrends.
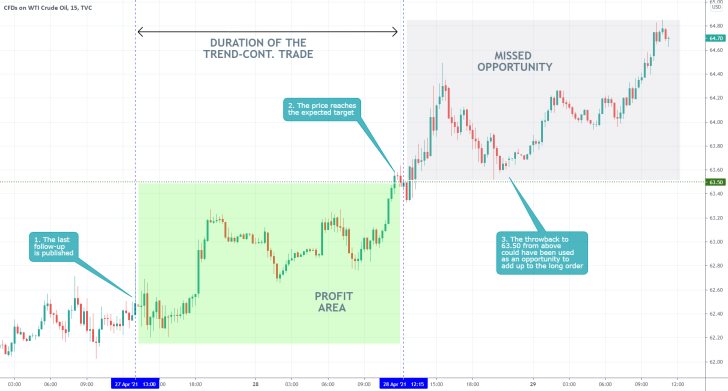
- The short-term expectations of the last follow-up were mostly realised in that an upswing to the 63.50 resistance level was indeed established. However, the follow-up failed to predict the subsequent continuation of the upswing past the resistance.
- This example demonstrates the need for traders to be flexible. Once the price reaches the anticipated target, the SL can always be moved, or a floating TP implemented in order to squeeze the maximum out of such potential continuations of the directional trading.
Disclaimer: Your capital is at risk! Trading and investing on the financial markets carries a significant risk of loss. Each material, shown on this website, is provided for educational purposes only. A perfect, 100% accurate method of analysis does not exist. If you make a decision to trade or invest, based on the information from this website, you will be doing it at your own risk. Under no circumstances is Trendsharks responsible for any capital losses or damages you might suffer, while using the company’s products and services. For more information read our Terms & Conditions and Risk Disclaimer.


