The price action of crude oil appears to be in the early stages of establishing a new bearish trend, as it attempts to break down below the lower boundary of a major consolidation range. This range serves as a Distribution of a broader Wyckoff Cycle, which means that the trend reversal if it is indeed to take place, would likely be marked by predictable behaviour of the price action.
And there are plenty of fundamental factors to consider that seem to be congruent with the expectations for a decisive trend reversal. British economic activity was staved off in the third quarter, underpinning diminished demand. This could exacerbate crudes struggles in the short term.
Meanwhile, the anticipated uptick in U.S. consumption this week is mostly owing to persisting supply bottlenecks worldwide, which does not really signify heightened energy demand. Both factors are therefore likely to highlight a possible selloff in the price of crude oil.
However, despite all of these selling indications, bears should be careful where they decide to join the currently emerging downtrend. That is so because the market's transition from one state into another is typically typified by heightened adverse volatility, which could be detrimental to poorly executed orders.
In other words, bears should closely monitor the behaviour of the price action around the lower limit of the Distribution range.
Probing the Distribution Range
As can be seen on the daily chart below, the Distribution range spans between the major resistance level at 84.50 and the psychologically significant support level at 80.00, underpinned by the 23.6 per cent Fibonacci retracement level. The former has already been tested on two separate occasions, while the latter only once.
The second attempt at a breakdown below the range, which is currently unfolding, commenced as a Bearish Engulfing, indicating heightened selling pressure. The price action broke down below the 20-day MA (in red), currently underpinning the major support-turned-resistance at 82.30, and is currently testing the 23.6 per cent Fibonacci.
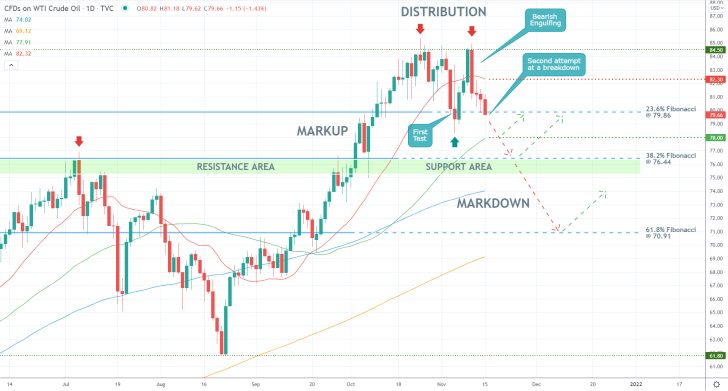
If it succeeds, the next target would be the support level at 78.00, underscored by the 50-day MA (in green). The more prominent target is the 38.2 per cent Fibonacci at 76.44, which also indicates the previous swing peak.
Notice also that the 76.44 threshold pierces the previous Markup in two equal halves, making it an even more prominent turning point. The deepest target is the 61.8 per cent Fibonacci at 70.91, which would soon converge with the 200-day MA (in orange).
The Price Between Several Crucial Moving Averages
Bears should consider very carefully the possibility of entering short around the current spot price because of the behaviour of the price action on the 4H chart below. Notice that the 100-day MA (in blue) crosses the above-mentioned level at 82.30, making it an even more prominent resistance. The same can be said in relation to the 300-day MA (in purple) nearing the 78.00 support level.
Meanwhile, the 200-day MA (in orange) at 81.00 and the 250-day MA (in black) at 79.30 indicate an even narrower consolidation range around the 23.6 per cent Fibonacci retracement, which is where adverse fluctuations in both directions are likely to occur. Traders should be especially careful when choosing to enter between these two extremes.
Notice that a Hammer candlestick occurred the last time the price action tested the support area just below the 23.6 per cent Fibonacci, which was then followed by a bullish rebound. That is why bears should keep in mind that the same could occur once again.
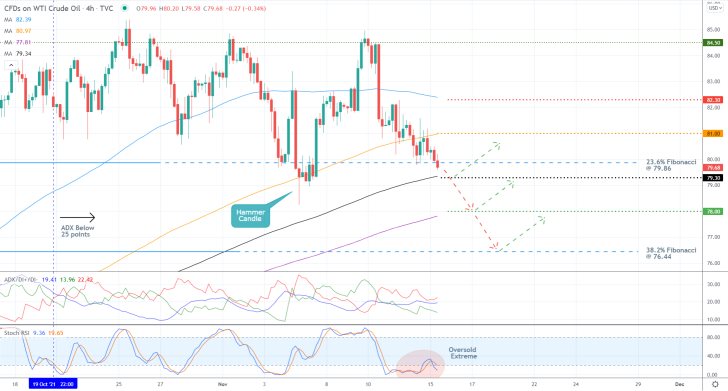
Moreover, the ADX indicator has been threading below the 25-point benchmark since the 19th of October, which means that the market is still technically range-trading. Under these conditions, the emergence of snap rebounds/reversals from prominent support and resistance levels is especially probable. This is especially important given that the Stochastic RSI is currently threading in its oversold extreme, which is likely to cause an upsurge in buying pressure around the current dip in the near future.
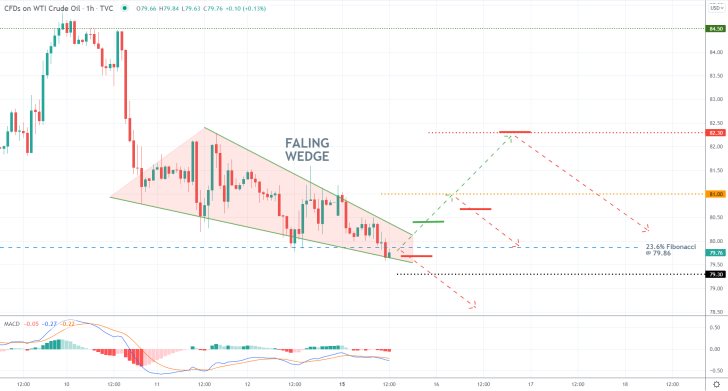
There are even more reasons to anticipate a temporary bullish pullback to take place before the price can resume heading lower, as can be seen on the hourly chart below. The price action appears to be developing a Falling Wedge pattern at the 23.6 per cent Fibonacci, which in itself is a probable indication of mounting bullish bias.
Additionally, the MACD underpins a slight prevalence of bearish momentum, though the histogram of the indicator remains mostly subdued. This could be a prelude to an upcoming uptick in bullish momentum.
Concluding Remarks
Bears should consider entering short only on the condition that the price action remains concentrated below the 23.6 per cent Fibonacci in the next several hours or if there is a decisive breakdown below the psychologically significant support at 80.00. At any rate, their supporting stop-loss orders should not exceed $0.70 above their initial entries.
As stated earlier, the 38.2 per cent Fibonacci retracement level at 76.44 is the next major target for the emerging downtrend. However, bears can also opt to substitute their fixed stop orders for floating TPs once the price breaks below 79.30, so they can protect themselves against sudden changes in the direction of the price action.
More risk-averse bears, in turn, could wait and see whether the price action establishes a bullish pullback from the 23.6 per cent Fibonacci before they execute any selling orders. They could then look for an opportunity to sell either at 81.00 or 82.30.
As regards the current trading opportunities for bulls, they can consider entering long if the price breaks out above the Wedge's upper limit, around 81.40. Their SLs should not be deeper than $0.50. Bulls should then consider collecting their profits around 82.30.
What Does Crude Oil's Falling Wedge Entail?
The price action of crude oil has been establishing a Falling wedge pattern recently, which could potentially signify the likely beginning of a temporary bullish pullback. Falling wedges, when found within an underlying downswing, are typically taken to signal likely bullish reversals. Under the current market conditions, however, this is more likely to cause a minor bullish correction as opposed to a decisive uptrend.
The market has so far failed to react to the recent escalation of tensions between Russia and Ukraine, which means that the broader bearish sentiment is likely to prevail in the medium term. Nevertheless, this does not preclude the possibility of intermittent fluctuations in the short term.
Meanwhile, the expectations for diminished trading activity over the next five days owing to the relatively uneventful calendar for this week, predisposes the underlying environment to be more suitable for the emergence of such corrections.
Hence, the current setup seems suitable for the implementation of contrarian trading strategies by bulls in the short term. Meanwhile, bears can wait for the completion of the next pullback before they utilise trend continuation strategies by selling the peak of the eventual pullback. The underlying trading opportunities are thus similar to the ones already observed on the EURUSD pair earlier today.
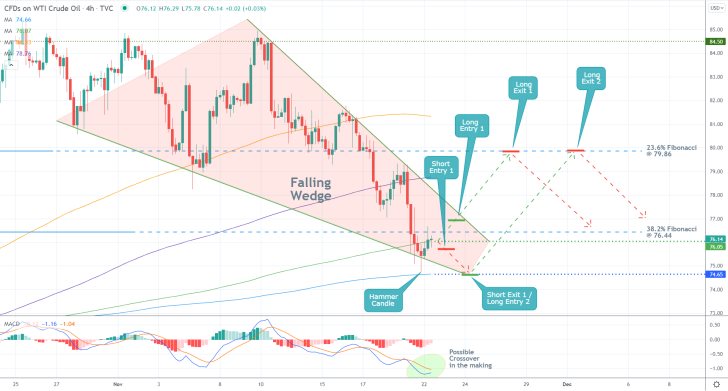
As can be seen on the 4H chart below, the bottleneck of the Falling Wedge has just closed below the 38.2 per cent Fibonacci retracement level at 76.44. Owing to the psychological significance of the latter, the emergence of a bullish pullback is made even likelier.
Moreover, a Hammer candlestick, which typically signifies likely bullish rebounds, occurred from the 500-day MA (in blue), which corroborates the primary expectations. On the other hand, the price action is currently consolidating just below the major resistance level at 76.05, underpinned by the 400-day MA (in green). This implies that the price action could fall to the 500-day MA once more before the bullish pullback starts developing.
All of this is taking place as the underlying momentum remains ostensibly bearish-oriented, as depicted by the histogram of the MACD indicator. Nevertheless, a likely crossover between its 12-day EMA (blue) and the 26-day EMA (orange) would signify a recent change in the underlying buying and selling pressures.
Provided that the price action reverses from the 76.05 resistance in the next several hours, bears can look for an opportunity to enter short on the expectations for another dropdown to 74.65. Their supporting stop-loss orders should not exceed $0.50 from their initial entries.
In contrast, bulls can seek to enter long either just above the upper limit of the Wedge around 77.00 or at 74.65. In both cases, their target would be the same - the 23.6 per cent Fibonacci at 79.86. Similarly to bears, bulls' stop-losses should not exceed $0.50.
The Price of Crude Pulls Back Ahead of the OPEC Meeting
The price of crude oil started developing a new downtrend recently, following a decisive breakdown below a massive Distribution range. Given the expectations of the Wyckoff Cycle method, this is now likely to be followed by the continued development of said Markdown in the near term.
Before this happens, however, the price action of the commodity looks poised to establish a minor bullish pullback in the short term. This is happening just before this week's highly anticipated OPEC meeting, which can be exploited by bears looking to implement trend continuation strategies.
At the meeting, members of the ministerial committee are expected to highlight the persisting conformity under the OPEC Declaration of Cooperation (DoC), which could catalyse the expected pullback. However, the broader market sentiment is promptly turning bearish.
The recent tribulations stemming from the Omicron variant have prompted an adverse reaction amongst traders and investors in an already fearful market. This has prompted a selloff of higher-risk assets, which is affecting crude as well. Thus, bears can wait for the underlying pullback to reach a new peak in the short term before they place selling orders on the expectations for continued price depreciation in the following days and weeks.
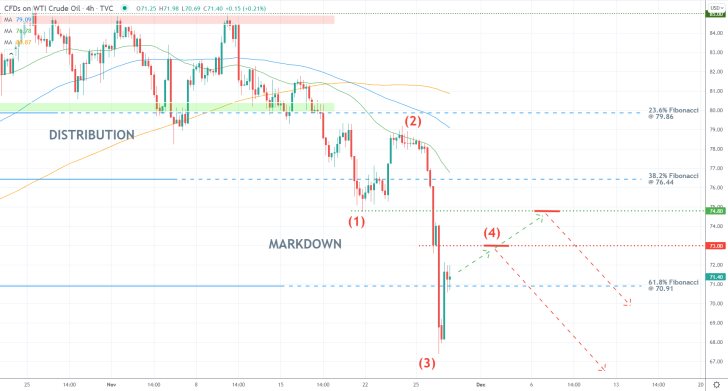
As shown on the 4H chart above, the new Markdown emerged following a breakdown below the lower limit of the Distribution range - the 23.6 per cent Fibonacci retracement level at 79.86. It appears to be taking the form of a 1-5 impulse wave pattern, as postulated by the Elliott Wave Theory.
Hence, the pullback serves as the second retracement leg (3-4), which means that bears would be trying to sell at the anticipated third and final impulse leg (4-5). On the one hand, a major indication of the strong bearish sentiment is the perfect descending order; the price action being concentrated below the 50-day MA (in green), threading below the 100-day MA (in blue), threading below the 200-day MA (in orange).
On the other, the recent Bullish Engulfing candle penetrated back above the 61.8 per cent Fibonacci at 70.91, which is why bears should be patient not to enter short prematurely. Depending on their level of risk-aversion, bears can place short limit orders at one of the two previous swing lows - either at 73.00 or 74.80. At any rate, their supporting stop-loss orders should not exceed $0.40 from their initial entries.
Once the price action breaks down below the 61.8 per cent Fibonacci once again, bears would be able to substitute their fixed stop orders for floating TPs in order to squeeze the maximum out of the dropdown further down south.
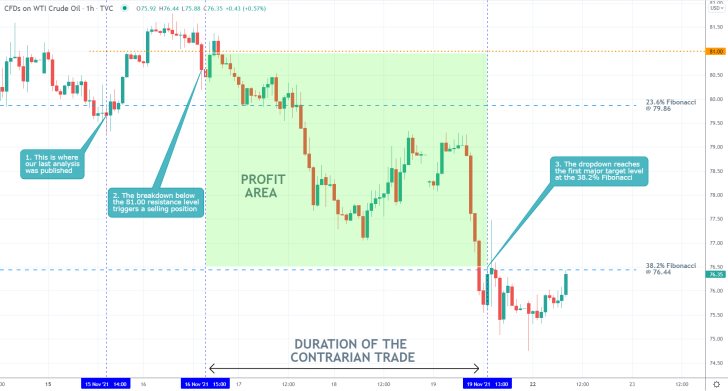
- Our latest crude oil analysis is proving to be a massive success. It successfully forecasted a sizable bearish reversal from the 81.00 resistance level, followed by a dropdown to the 38.2 per cent Fibonacci retracement level at 76.44.
- So far, the analysis has caught nearly $4.50 from the new downtrend, amounting to 5.48 per cent profits.
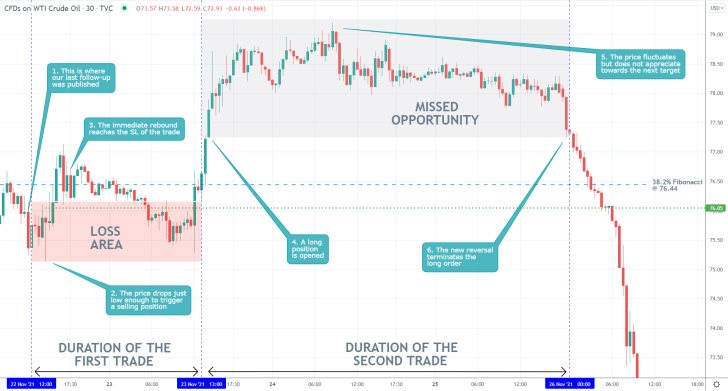
- The forecasts of our latest crude oil analysis were not fulfilled. Shortly after its release, the price action fell low enough to signal the execution of a short order. However, the immediate rebound triggered the supporting stop-loss order shortly afterwards.
- A long order was then placed on a breakout play above the 38.2 per cent Fibonacci retracement level at 76.44, but the subsequent consolidation did not reach the next target (the 23.6 per cent Fibonacci).
- This is a good example of why traders need to move their stop-loss orders to a breakeven level after the price action had moved sufficiently in their favour in order to protect themselves against sudden reversals.
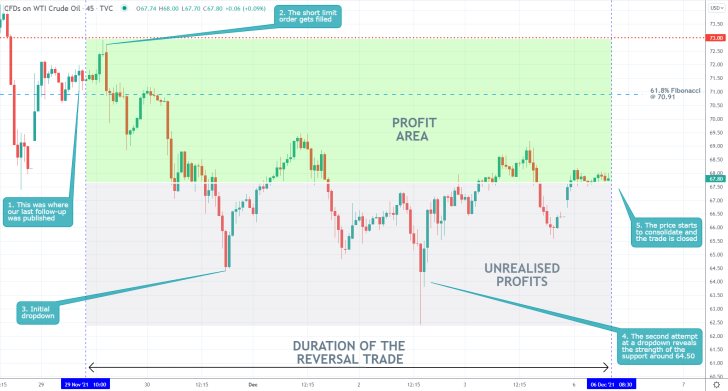
- Our last follow-up of crude was a major success. It forecasted a reversal from the 73.00 resistance, resulting in a decisive breakdown below the 61.8 per cent Fibonacci retracement level at 70.91.
- The reason for the substantial dropdown was the latest OPEC+ meeting, on which Russia proposed an increase in the production of oil.
Disclaimer: Your capital is at risk! Trading and investing on the financial markets carries a significant risk of loss. Each material, shown on this website, is provided for educational purposes only. A perfect, 100% accurate method of analysis does not exist. If you make a decision to trade or invest, based on the information from this website, you will be doing it at your own risk. Under no circumstances is Trendsharks responsible for any capital losses or damages you might suffer, while using the company’s products and services. For more information read our Terms & Conditions and Risk Disclaimer.


