Crude oil opened this week's trading session by nearing a price tag of 68.00 dollars per barrel before retracing back to 66.30. The jump was caused by fears of escalating tensions in the gulf, underpinned by the raging war between Saudi Arabia and the Iran-backed Houthi rebels. The Saudi Energy Ministry reported that a drone strike targeted an oil storage tank on Sunday, stirring temporary panic over potential disruptions to production.
It was later reported that no lives were lost during the strike, nor any damages inflicted upon Saudi Arabia's oil facilities, which offset some of the initial fears. Nevertheless, the strike exposed gaps in Saudi Arabia's defence parameter, signifying the possibility for more destructive attacks in the future.
The energy market remains unnerved even as the initial volatility outburst is now subsiding. Meanwhile, the demand for crude remains high as global economic activity continues to pick up. And this week's U.S. inflationary data is likely to bolster this trend. All of this is happening as investors' sentiment is changing, underpinned by easing economic circumstances.
Overall, the underlying factors seem to favour the likely continuation of crude's rally in the foreseeable future. Even still, the precious commodity appears to be getting ahead of itself, increasing the possibility for a bearish correction.
1. Long-Term Outlook:
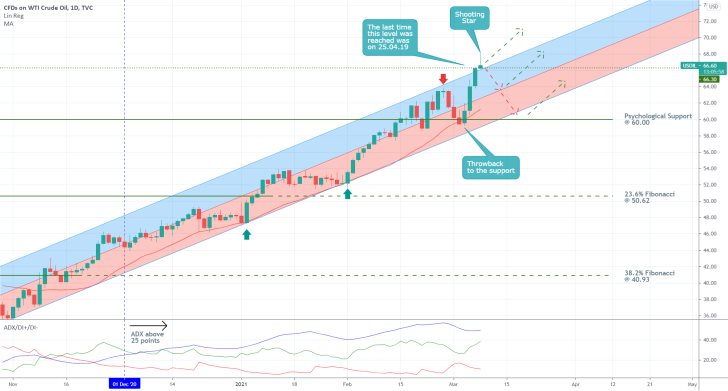
The strength of the underlying bullish rally is demonstrated on the daily chart below. The price action is currently probing the strength of the major resistance level at 66.30, which has been prevalent since the 25th of April 2019. As can be seen, today's candle is currently taking the form of a Shooting Star, which typically indicates rising bearish bias and a potential reversal. The candle's sizable upper shadow manifests the aforementioned upsurge in volatility brought about by yesterday's drone strike.
Seeing as how the Shooting Star appears to be forming at the 66.30 resistance, which is currently converging with the upper boundary of the ascending channel, this sets the stage for a likely dropdown towards the channel's middle line or the psychological support at 60.00. The latter is still threading very close to the channel's lower edge, making it a likely contender for a deeper bearish correction.
While these expectations open up the possibility for contrarian trading on the part of the market bears, they should keep in mind that the broader sentiment remains ostensibly bullish-oriented. This is confirmed by the ADX indicator, which demonstrates that the bullish uptrend has been gaining strength since the 1st of December.
2. Short-Term Outlook:
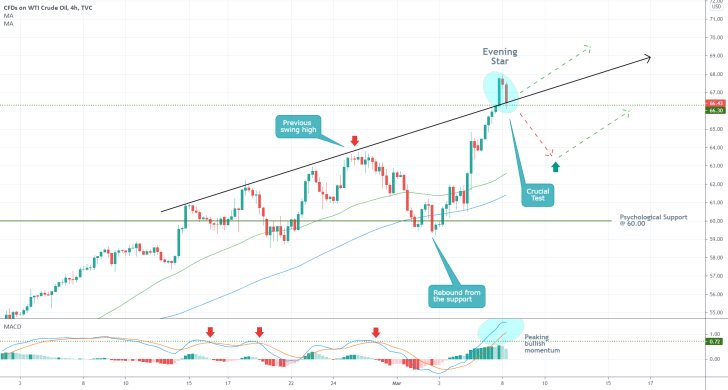
As can be seen on the 4H chart below, the possibility for the emergence of a bearish correction is signified by the development of an Evening Star pattern near the latest swing high.
At present, the price action is probing the 66.30 resistance (currently support) from above, which is likely to turn into a make-it-or-break-it point for the bearish expectations. Namely, a potential breakdown below this resistance-turned-support in conjunction with a retracement below the ascending trend line (in black) will substantiate the expectations for such a correction. In contrast, a bullish rebound from 66.30 will manifest the probable termination of these bearish forecasts.
At present, the peaking bullish momentum, as elucidated by the MACD indicator, presupposes such a correction, as bears are likely to regain some momentum in the near future. Provided that the price action manages to break down below 66.30, the next target for the emerging correction will be encapsulated by the previous swing high, around 64.00. The 50-day MA (in green) is currently converging towards this level, making it more likely for such a correction to be exhausted there.
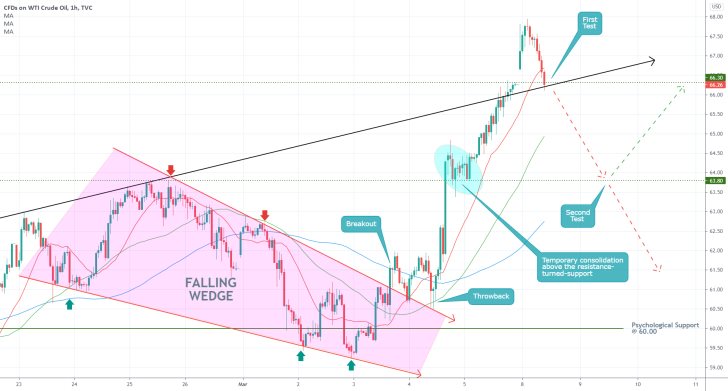
Notice the Falling Wedge pattern on the hourly chart below, which was exhausted just above the psychological support at 60.00. Its highest point is at 63.80, which represents a more precise target level (compared to the above-mentioned support at 64.00) for a potential dropdown.
In other words, the highest point of the Wedge confirms the previous assertion regarding the likely dip of the next correction. This is further substantiated by the fact that the 63.80 level's prominence as a support level was already confirmed once - represented by the temporary consolidation range.
It follows that there will be two crucial tests of the mounting bearish pressure - the 66.30 support and then the 63.80 support. The recent break down below the 20-day MA (in red) represents an early signal of the first test's completion.
3. Concluding Remarks:
If the first test is completed, bears can utilise contrarian trading strategies, entailing a high degree of risk. They will be eying a potential dropdown to 63.80, possibly even to the psychological support at 60.00 (if the second bearish test is successful as well).
On the other hand, more risk-averse bulls can wait for such a correction to be exhausted before they buy into the existing trend. They can start looking for signs that the market is bottoming out around either of the three aforementioned supports, which will allow them to utilise trend-continuation trading strategies.
Crude Oil Bounces Back from the Crucial Resistance at 66.30
The price of crude oil looks set to attempt breaking lower following a recent bearish rebound from the major resistance level at 66.30. The significance of the latter as a potential turning point was argued in the initial analysis.
The commodity has been rallying over the last few weeks amidst growing global demand and improving economic conditions. This trend of steadily increasing demand is likely to persist in the next quarter, as central banks maintain their massively accommodative policy stances and governments bolster their own fiscal policies.
Nevertheless, this increasingly bullish outlook does not mean that crude's underlying uptrend will continue climbing uninterruptedly. Quite the contrary, the emergence of an interim correction seems like the most plausible outcome in the short-term as bulls recalibrate their positions.
These projections can allow bears to utilise contrarian trading strategies, which typically entail a high degree of risk, eyeing such a dropdown in the near future. In contrast, bulls can wait for the completion of the bearish pullback before they utilise trend-continuation strategies. Their goal will be to join the uptrend at a discount at the correction's resulting dip.
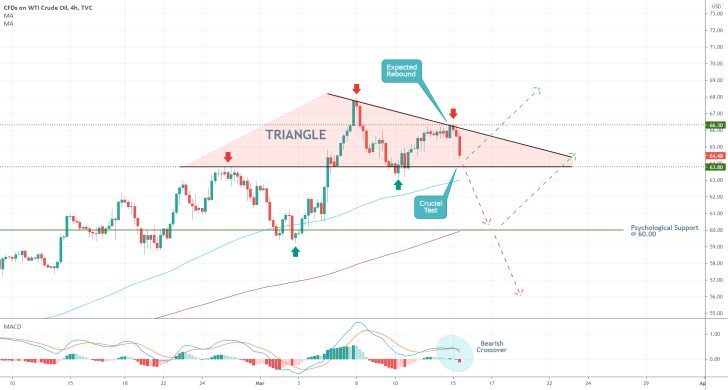
As can be seen on the 4H chart above, the underlying price action currently appears to be establishing a Triangle pattern. The aforementioned rebound from the 66.30 resistance constitutes a rebound from the Triangle's upper boundary as well. The price action is currently headed towards the Triangle's lower boundary at 63.80, whose prominence has already been tested on two separate occasions (once as a resistance and once as a support). This is creating a bottleneck, which is likely to be followed by a decisive breakout/down in either direction.
Notice that the Triangle's lower border is about to converge with the 100-day MA (in blue), which is making it an even more prominent support. That is why the first test for the reinstated bearish sentiment will constitute a decisive breakdown below the two. This will allow the correction to possibly drop to the psychologically significant support at 60.00, which is currently converging with the 200-day MA (in purple). In contrast, the emergence of yet another bullish rebound from the Triangle's lower boundary will potentially invalidate the bearish opportunity for the time being.
Finally, it is also worth mentioning that the MACD indicator has recently registered a bearish crossover, which is inlined with the underlying projections.
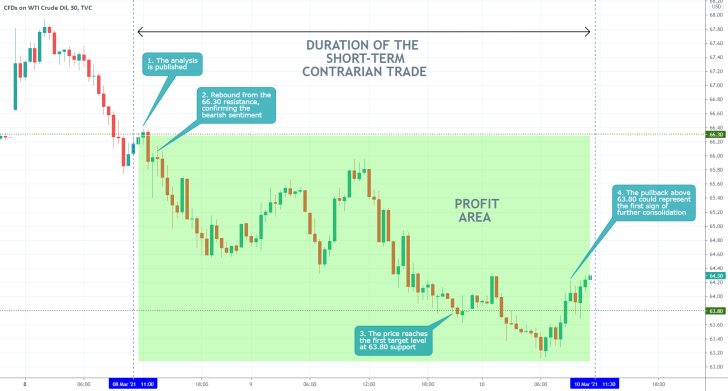
- The price action behaved exactly as per the expectations of the analysis. After a minor throwback to the 66.30 resistance, shortly after the publication of the analysis, it started diving. Eventually, the price action reached the first target level - the minor support at 63.80.
- Notice that the price action subsequently pulled back above 63.80, which could be interpreted as an early sign of potential bullish stabilisation. After all, the underlying trend remains prevailingly bullish-oriented.
- This is where market bulls can start looking for more confirmations of rising bullish bias, potentially allowing them to use trend-continuation trading strategies. They will be looking to go long at the dip before the price starts climbing once more, potentially around 63.80.
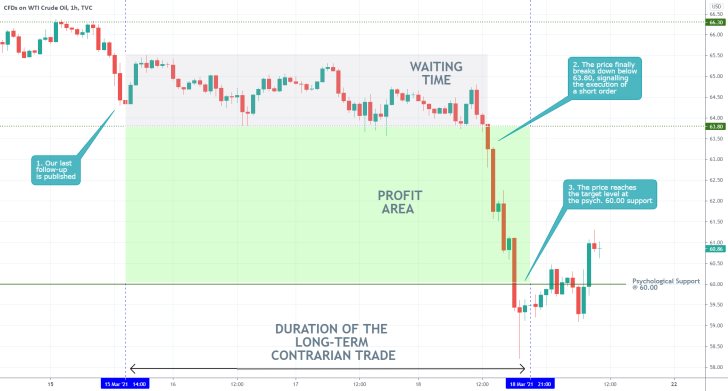
- An overwhelmingly successful trade. The last follow-up successfully forecasted the eventual breakdown below the 63.80 support, which represented the selling signal that was anticipated by the follow-up. Afterwards, the price action dropped to the psychological support level at 60.00, which served as a target level for the trade.
- The biggest takeaway here is that patience is especially important in trading, given that it took three days for the position to be closed with a profit.
Disclaimer: Your capital is at risk! Trading and investing on the financial markets carries a significant risk of loss. Each material, shown on this website, is provided for educational purposes only. A perfect, 100% accurate method of analysis does not exist. If you make a decision to trade or invest, based on the information from this website, you will be doing it at your own risk. Under no circumstances is Trendsharks responsible for any capital losses or damages you might suffer, while using the company’s products and services. For more information read our Terms & Conditions and Risk Disclaimer.


