Demand for the commodity looks poised to depreciate in the medium term as the impact of market seasonality starts to play a bigger role in the underlying supply and demand dynamics. That is so because global economic activity tends to fall over the latter portion of the second quarter, which consequently eases said demand.
In addition to market seasonality, there are other reasons to expect bumpy peaks and valleys in aggregate demand for crude oil over the near future, underpinning the widening discrepancies in global recovery.
Key production numbers are scheduled for release this week, including U.S. manufacturing and services PMI data, as well as corresponding industry numbers from developing economies. The findings of these reports are likely to underscore the uneven recovery progress that is being observed between the developed world and emerging markets.
Despite OPEC's commitment to stabilise the oil market, which was the primary reason as to why the price of crude managed to surge past the 60.00 threshold, the underlying conditions seem to be favourable for the establishment of a new bearish correction in the near future.
1. Long-Term Outlook:
As was already shown in the previous WTI analysis, the price action is currently behaving as per the expectations of the Wyckoff Cycle Theory. Chiefly, the price is presently consolidating within the boundaries of a major consolidation range after having completed a Markup beforehand.
The Distribution range spans between the psychologically significant support level at 60.00 and the major resistance at 66.00. Before the market can develop a new Markdown, which would be the logical outcome of the Cycle, the price has to test the lower boundary of the range at least once. This is why a future dropdown to 60.00 seems highly probable.
Notice that the ADX indicator has been threading below the 25-point benchmark level since the 16th of April, which confirms the Wyckoff expectations that the price of crude is currently range-trading. Meanwhile, the Stochastic RSI indicator is still contained within its overbought extreme, which substantiates the expectations for mounting selling pressure in the near future.
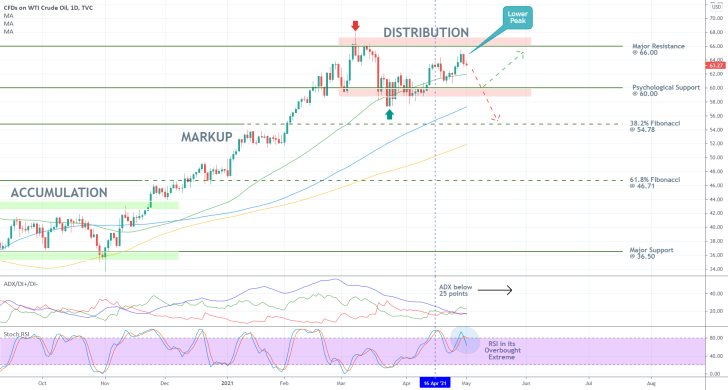
If the price manages to break down below the 50-day MA (in green), which currently serves the role of a floating support, it would then be free to test the aforementioned support. Notice that the 100-day MA (in blue) is nearing the psychologically significant support at 60.00, which would increase its prominence.
In other words, another rebound towards the Distribution's upper boundary would be made plausible by the convergence of the two. On the other hand, the price action established two lower peaks recently, which increases the likelihood of a more sizable dropdown.
If the price of crude manages to break down below 60.00, its next major target would be represented by the 38.2 per cent Fibonacci retracement level at 54.78. The latter's psychological significance is further bolstered by the fact that it is about to converge with the 150-day MA (in orange).
2. Short-Term Outlook:
As can be seen on the 4H chart below, the latest rebound from the Distribution's lower end takes the form of a harmonic ABCD pattern. This is a type of pattern that is typically taken to signify likely bearish reversals. Such a turnaround occurred at point D, which was exactly inlined with the expectations of the pattern.
Hence, the price action is now likely to drop at least towards the last swing low at point C (60.50). The latter is positioned quite close to the lower boundary of the Distribution, which confirms the expectations for a test of the 60.00 level.
The recent bearish crossover on the MACD indicator underpins this resurgence of bearish momentum in the market, which is fuelling the underlying correction.
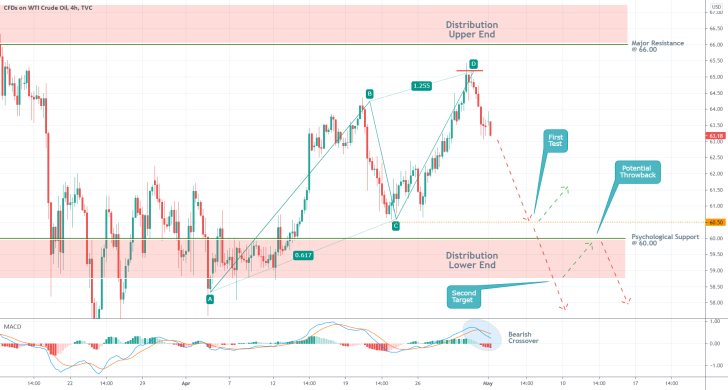
Bears should be on the lookout for a potential rebound from 60.50, which, as mentioned earlier, could allow for another rebound towards the upper boundary of the Distribution. However, if the price manages to break down below 60.00 decisively, this could potentially signify the beginning of a new Markdown.
Such a breakdown is then likely to be followed by a throwback to 60.00 from below before a broader downtrend could continue to unfold. This would allow market bears to either add up to their existing positions or open new ones on the expectations for a deeper tumble.
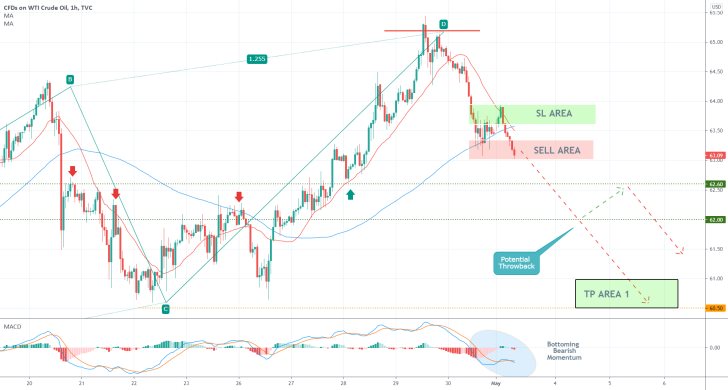
Notice that the price action has already broken down below the 100-day MA on the hourly chart below. Moreover, the 20-day MA (in red) is just crossing below the 100-day MA, which confirms the mounting bearish bias in the short term. This allows for the execution of short orders around the current market price.
Bears would do well to place narrow stop losses. Preferably just above the two moving averages. The first target is encapsulated by the TP Area 1, around 60.50. Keep in mind that a minor bullish pullback could emerge within the range spanning between 62.00 and 62.60. Such a pullback would also be suitable for the implementation of trend continuation strategies by virtue of adding to the existing selling orders.
However, bears should also be mindful of the underlying momentum in the very short term. The MACD indicator appears to be bottoming out on the hourly chart, which could be a precursor to an immediate bullish pullback. This could cause intermittent fluctuations to the SL Area before the price gets ready to resume falling.
3. Concluding Remarks:
The devastating second wave of the coronavirus pandemic in India is threatening an adverse fallout on emerging markets, which, as stated above, represents a considerable threat to global demand. It is precisely because of the expectations for lessened crude oil demand in the near future that a correction towards 60.00 is expected on the price of crude.
Nevertheless, it should not be forgotten that the price of the commodity remains concentrated within the boundaries of a major Distribution range, which is why a rebound from 60.00 is also possible.
The Price of Crude Developing a Head and Shoulders Pattern
Crude oil bulls continue to retain control in the short term, despite the fact that bearish pressure is mounting. The global uptick in economic activity drove the price of the commodity higher this week, as the global recovery continues to strengthen. Nevertheless, the peaking price may be set for a more sizable bearish correction.
The April Non-Farm Payrolls in the U.S. are going to be the key catalyst to watch out for, as the labour market data is going to underpin the supply and demand pressures for the near future.
Even though the consensus forecasts anticipate the U.S. economy to have expanded by more than 1 million jobs over the previous month, the number of people that have been left out of the labour force decidedly is projected to remain high.
The U.S. recovery continues to be plagued by unevenness across different sectors, which poses a considerable threat to future growth. That is why despite the initial forecasts expecting an overall robust labour market performance, headline uncertainty is likely to persist.
Such an unpredictable environment, in turn, is likely to cause more fluctuations on the price action of the commodity, which is inlined with the expectations for the development of a major Head and Shoulders pattern. This represents a classic bearish reversal pattern.
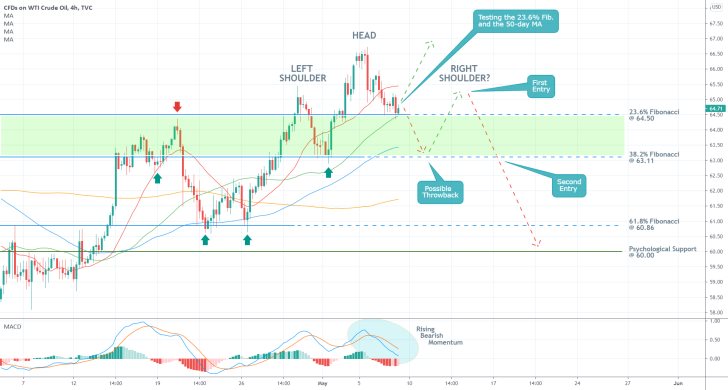
As can be seen on the 4H chart above, the price action is currently consolidating just above the 23.6 per cent Fibonacci retracement level at 64.50, which coincides with the 50-day MA (in green). The latter serves as a floating support. A potential rebound from the present level would underpin continued bullish pressure, thereby providing bulls with an opportunity to add up to their long orders.
On the other hand, a dropdown to the 38.2 per cent Fibonacci retracement level at 63.11, which is converging with the 100-day MA (in blue), would imply the likely future development of the broader Head and Shoulders pattern.
A subsequent rebound from 61.11, followed by the establishment of a swing peak at around 65.50, could be interpreted as the creation of the Right Shoulder of the pattern. This, in turn, can be used by bears as an indication of an imminent downtrend.
They can look for an opportunity to enter short either at the peak of the Right Shoulder or just below the 38.2 per cent Fibonacci retracement level. Such a downtrend could head towards the 61.8 per cent Fibonacci retracement level at 60.86, which is quite close to the psychologically significant support level at 60.00.
Bearish momentum in the short term is likely to remain, as demonstrated by the MACD indicator. This would favour the aforementioned possibility for an intermittent dropdown to the 38.2 per cent Fibonacci retracement level.
Crude Oil's Double Top, Currently in the Making
The heightened demand in the energy market for crude oil may finally be ready to diminish a bit. It was initially prompted by the global uptick in economic activity but now that soaring inflation is becoming a problem, the turmoil in the equity market is likely to stymie this demand.
In other words, the prospects of overheating the global economy are likely to impede the rally in the commodities market, which, in turn, would likely have an adverse impact on the price of crude oil. That is so because traders and investors are becoming increasingly more interested in lower-risk securities.
Thus, the overbought crude oil may finally establish the long-anticipated bearish correction.
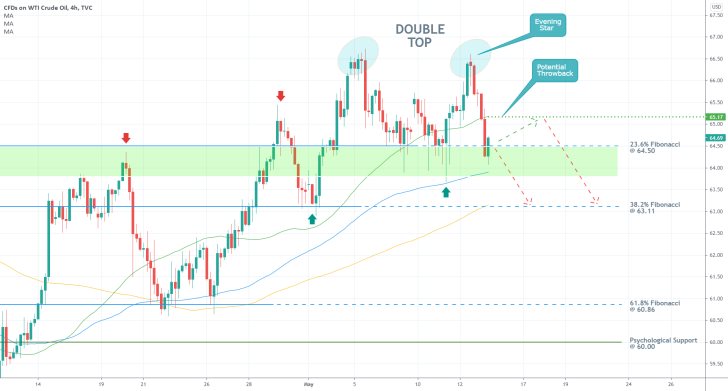
As can be seen on the 4H chart above, the price of the commodity established a Double Top pattern recently, which entails rising bearish sentiment. This is a type of reversal pattern that is typically associated with the likely emergence of a new downtrend.
Moreover, the peak of the Right Top takes the form of an Evening Star pattern, which substantiates the expectations for the completion of a trend reversal in the near future.
Notice that the price of crude broke down below the 23.6 per cent Fibonacci retracement level at 64.50 recently, marking the first major step in the development of a new downtrend. The next substantial obstacle that needs to be overcome is the consolidation area (in green). It spans between the 23.6 per cent Fibonacci and the 100-day MA (in blue).
The consolidation area could prompt the emergence of a minor bullish pullback, which could reach the 50-day MA (in green) from below. Currently, the latter is positioned at the 65.17 price level. In other words, such a potential pullback encapsulates the current risks for bears.
Meanwhile, a decisive breakdown below the 100-day MA would allow the price of crude to target the next major target - the 200-day MA (in orange). At present, the latter coincides with the 38.2 per cent Fibonacci retracement level at 63.11, making it an even more prominent target.
The deepest target level for a bigger downtrend is underpinned by the 61.8 per cent Fibonacci retracement level at 60.86. The latter's close proximity to the psychologically significant support level at 60.00 makes it an even more interesting target.
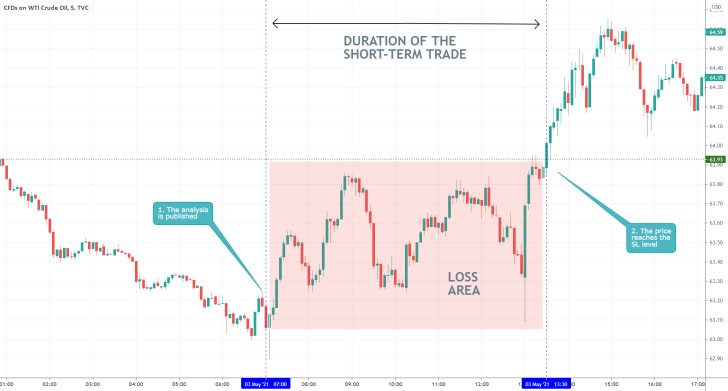
- The price of crude oil rebounded almost immediately after the release of the analysis, hitting the SL shortly afterwards. While the analysis was correct in forecasting the consolidation of the price action within the boundaries of a broader range, it failed in projecting a continued price depreciation in the short term.
- That is a good example of why traders should enter the market only at the most opportune moments - joining an existing directional movement bears its risks from sudden changes in the underlying direction of the price.
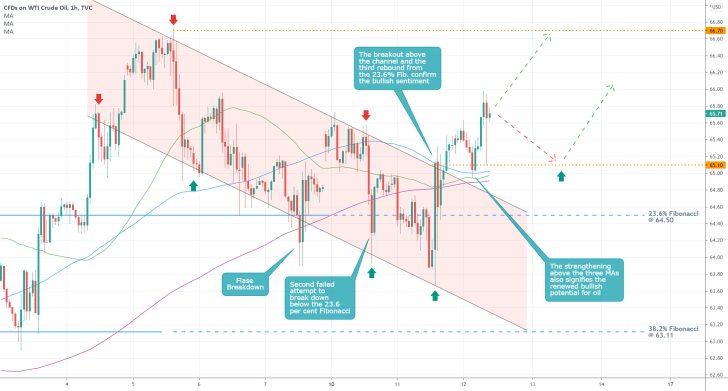
- Even though the expectations of the last follow-up for the development of a Head and Shoulders Pattern were not realised, the follow-up was successful in preventing any losses. That is so because it was emphasised on the need for a decisive breakdown below the 23.6% Fibonacci retracement level to confirm the establishment of the pattern.
- Given that the price action has since then consolidated above the upper boundary of the descending channel and the 23.6 per cent Fibonacci, the market is once again assuredly bullish.
- Bulls can use this to take advantage of a likely upswing towards the 66.70 resistance level. Meanwhile, the 65.10 support level should be perceived as a make-it-or-break-it point for this reinvigorated bullish outlook.
- Seeing as how the market has already bottomed out, the implementation of long orders using trend continuation strategies seems justified at present.
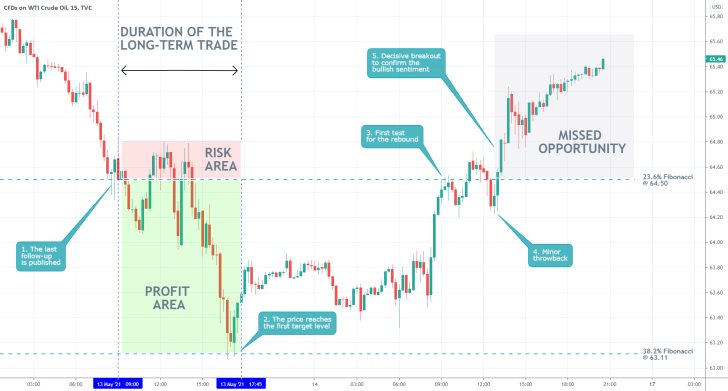
- The price of crude oil expectedly sunk to the 38.2 per cent Fibonacci retracement level, which was forecasted by the last follow-up.
- Nevertheless, the subsequent rebound was not expected, and thus the opportunity for contrarian trading was missed.
- Despite that, something can still be learned from the behaviour of the price action around the 23.6 per cent Fibonacci retracement level after the rebound started taking shape.
- The breakout above the 23.6 per cent Fibonacci happened in a classic way - first test of the resistance, followed by a breakout and subsequent throwback (below the resistance). Finally, the decisive breakout confirmed the bullish sentiment and could have been used by bulls to add to their existing orders or open new ones.
Disclaimer: Your capital is at risk! Trading and investing on the financial markets carries a significant risk of loss. Each material, shown on this website, is provided for educational purposes only. A perfect, 100% accurate method of analysis does not exist. If you make a decision to trade or invest, based on the information from this website, you will be doing it at your own risk. Under no circumstances is Trendsharks responsible for any capital losses or damages you might suffer, while using the company’s products and services. For more information read our Terms & Conditions and Risk Disclaimer.


