The price of the commodity broke out above $90 per barrel last week, which represents the last major threshold before the psychological barrier at $100. This poses the question of whether soaring inflation and the tumultuous geopolitical landscape worldwide would drive the price higher, or whether it is time for a long-overdue correction?
A key insight will be provided later this week when the U.S. Bureau of Labour Statistics (BLS) publishes the inflation numbers for January, reflecting on the latest demand developments. According to the preliminary forecasts, the pace of inflation growth would decline marginally from a month prior, which could serve as a likely catalyst for a temporary correction on oil.
On the other hand, tensions alongside Ukraine's border with Russia remain high, exacerbating Europe's energy crisis risks. This whole situation precludes the possibility of any major dropdowns on the price of oil occurring before a resolution to the standoff can be reached. That is why traders should be especially careful how they exercise their positions near the peak of the latest rally.
Overall, bears might have a chance to bet on a minor dropdown in the very near future, though they should exercise contrarian trading strategies with caution due to the expectations for heightened volatility outbursts around the current psychologically significant barrier.
Those could be bolstered by the fact that the economic calendar for this week is relatively empty, possibly causing a sizable drop in overall trading activity. This, in turn, would lead to greatly diminished liquidity levels, making it even more plausible for erratic fluctuations to occur over the next several days.
Where is the Closest Resistance-Turned-Support?
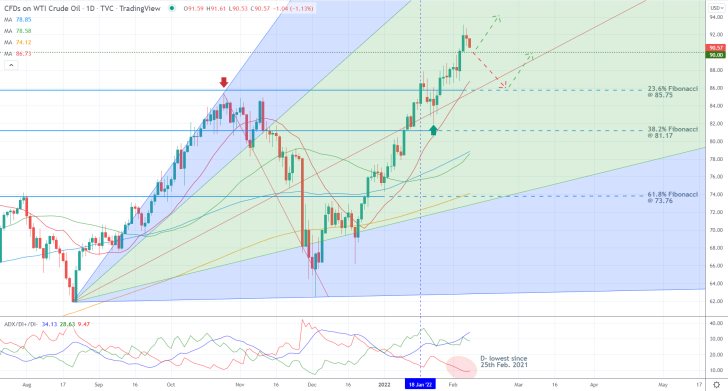
As can be seen on the daily chart above, today's dropdown is currently probing the psychologically significant resistance-turned-support at 90.00 from above. If it manages to close down below it, the next closest support would be the 23.6 per cent Fibonacci retracement level at 85.75.
In addition to being the last major swing peak, this threshold is currently converging with the middle line of the pitchfan and was recently crossed by the 20-day MA (in red). Both factors make it an even more prominent turning point where a potential correction is likely to be terminated.
If, however, the price action does manage to break down below this major barrier, the correction could then be extended towards the 38.2 per cent Fibonacci at 81.17, which is about to be crossed by the 50-day MA (in green) and 100-day MA (in blue). The third and final major support is unsurprisingly the 61.8 per cent Fibonacci at 73.76, converging with the 200-day MA (in orange) and the lower line of the pitchfan.
Meanwhile, the ADX indicator has been threading above the 25-point mark since the 18th of January, underpinning the strength of the bullish trend. But even more importantly, the current reading of the D- is at its lowest level since the 25th of February 2021. This means that the underlying selling commitment is at its weakest in almost a year, which is why the current opportunity for contrarian trading is not suitable for highly risk-averse bears.
The Make-It-Or-Break-It Barrier for a Correction
The latest upswing of the broader rally is represented as an ascending channel on the 4H chart below. Notice that the price action is currently testing the crossover between the minor support at 90.70, underscored by the 20-day MA, and the middle line of the channel.
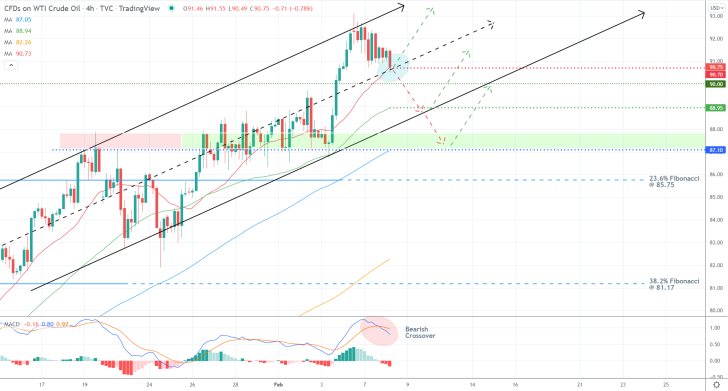
A breakdown below the 90.70 barrier would then clear the way for a test of the lower limit of the channel and the minor support at 88.95, highlighted by the 50-day MA. Just below those can be found the major resistance-turned-support area (in green), with a lower end at 87.10. The latter is presently being pinned by the 100-day MA.
The 12-day EMA (blue) has just crossed below the 26-day EMA (orange), as indicated on the MACD, implying a bearish crossover on the underlying momentum. At the same time, the histogram of the indicator is starting to decline. Both factors seem to substantiate the expectations for a bearish correction occurring in the near future.
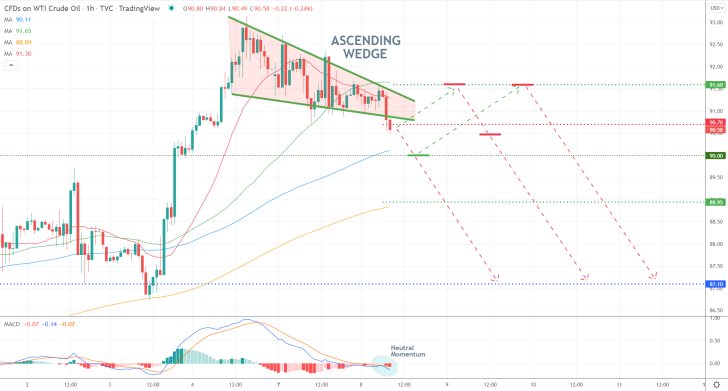
The likelihood of misleading price swings occurring in the next several hours is best illustrated on the hourly chart below. Notice that an Ascending Wedge pattern is unfolding at the swing peak, which is not a classic reversal pattern. Hence, the price action could continue to climb before an eventual correction does take place. This is further corroborated by the relatively neutral momentum, as demonstrated by the MACD.
The 200-day MA (in orange) adds to the significance of the 88.95 support; the 100-day MA does the same for the psychological support at 90.00, while the 50-day MA underpins the minor resistance at 91.60.
Concluding Remarks
Due to the expectations for more fluctuations around the 90.00 threshold in the near future, bulls and bears can take advantage of this in two different ways. Bulls can place long limit orders at 90.00 on the expectations for a rebound to 91.60. Their supporting stop-loss orders should not be placed deeper than 89.60.
Meanwhile, bears can place short limit orders at 91.60 on the expectations for a reversal towards 87.10. Their stop-loss orders should not be placed higher than 0.60 above their initial entry levels. Once the price action breaks down below the 90.00 threshold, bears would then be able to substitute their fixed stop orders for floating TPs in order to protect themselves against sudden bullish rebounds.
The Price of Crude Oil Likely to Rebound from $90.00
The price of crude oil continues to be rallying amidst the heightened geopolitical tensions between Russia, Ukraine, the EU, and U.S. Russia remains the biggest exporter of energy to the countries in the EU, which is why the risk of a potential war keeps the price of crude oil so high. The heightened demand may even prompt a test of the psychologically significant threshold at $100 per barrel.
The latest U.S. retail sales are scheduled for publication later this week, and the expectations for another solid uptick in consumption are likely to drive energy demand even higher. This is substantiated by the recent inflation findings in the country.
That is why the underlying set-up entails the opportunity for the implementation of trend-continuation strategies by bulls seeking to buy the dip of the next bearish correction.
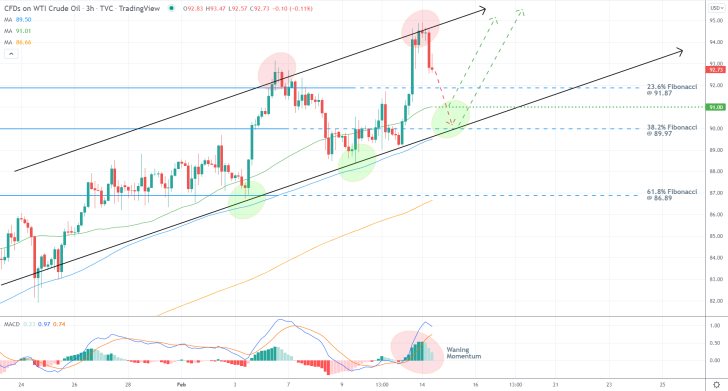
As can be seen on the 3H chart above, the price action appears to have reversed from the upper limit of the ascending channel. This signifies the likelihood of a new dropdown towards the lower limit of the channel. The first potential turning point for such a correction could be somewhere between the 23.6 per cent Fibonacci retracement level at 91.87 and the major support at 91.00, underpinned by the 50-day MA (in green).
The correction is, however, more likely to rebound from the crossover between the lower limit of the channel, the 100-day MA (in blue) and the 38.2 per cent Fibonacci at 89.97. The convergence of the three is made even more significant given that it is found just below the psychologically significant threshold at 90.00.
Meanwhile, the falling histogram of the MACD indicator underpins the mounting bearish bias in the short term. On the condition that a deeper bearish correction was to unfold, it could bottom out as low as the 61.8 per cent Fibonacci at 86.89, which is currently being crossed by the 200-day MA (in orange).
Bulls could place long limit orders at 90.00 on the expectations for a decisive rebound from this major threshold. Their supporting stop-loss orders should not be placed deeper than 89.30. Once the price action breaks out above the 23.6 per cent Fibonacci, bulls would be able to substitute their fixed stop orders for floating TPs. That way, they would simultaneously protect themselves against sudden dropdowns while also squeezing the maximum out of the breakout towards 100.00.
A Head and Shoulders Pattern Was Just Completed on Crude Oil
The price action of crude oil is currently consolidating near the peak of its latest uptrend. The massive rally was caused by the geopolitical tensions between Russia and Ukraine, as the threat of war exacerbated Europe's energy crisis. The countries of the Eurozone remain dependent on Russian oil and gas, which is why the prospects of supply disruptions prompted heightened investors' demand.
However, the timing seems right for the development of a minor bearish correction on the overbought price of the commodity. This opportunity can be taken advantage of by bulls and bears alike. The former can try to implement trend-continuation strategies at the dip of the eventual correction, whereas the latter can use contrarian strategies at present. The underlying outlook is thus very reminiscent of the currently developing opportunity on gold.
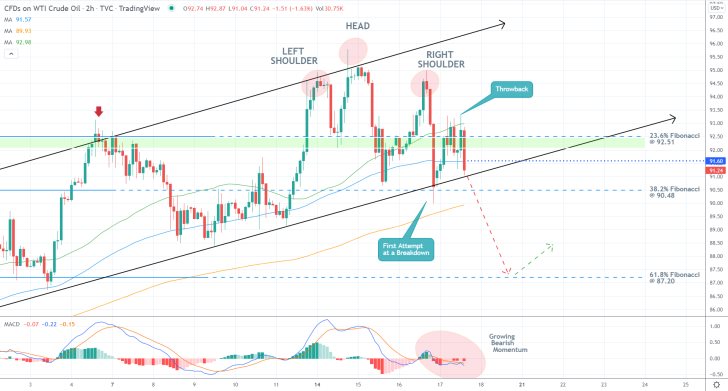
As can be seen on the 2H chart above, a Head and Shoulders pattern developed from the upper limit of the ascending channel, which is what signifies the likelihood of a bearish reversal. The declining histogram of the MACD indicator confirms this rising bearish momentum.
The 23.6 per cent Fibonacci retracement level at 92.51 indicates the previous swing peak, and it also serves as the neckline of the H&S pattern. Notice that the initial attempt at a breakdown below the neckline was followed by a snap rebound from the lower limit of the ascending channel. The subsequent throwback was exhausted at the 50-day MA (in green).
Bears seeking to enter short around the current spot price (90.80) should implement very narrow stop-loss orders; just above the major support-turned-resistance level at 91.60. The latter is underscored by the 100-day MA (in blue).
Once the price action breaks down below the 38.2 per cent Fibonacci at 90.48, which is about to converge with the 200-day MA (in orange), bears would be able to move their stop orders to breakeven. Their target would be the 61.8 per cent Fibonacci at 87.20.
Bulls, in contrast, can place long limit orders there, waiting for a probable bullish rebound. Their supporting stop-losses should not be deeper than $1.80 below their initial entries as well.
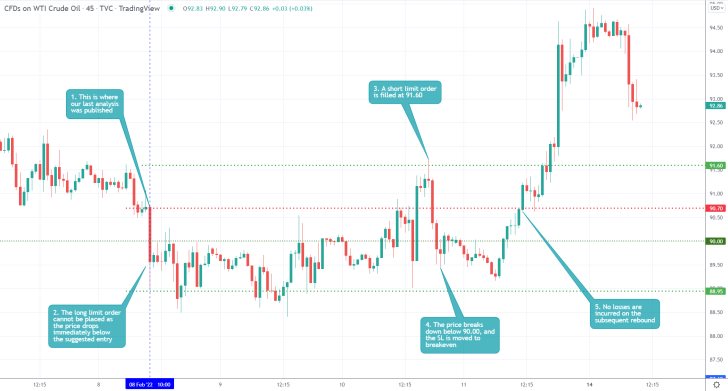
- Even though our last analysis of crude oil failed to generate any profits, it is still considered a success. That is so because the trade execution prevented any losses as well.
- A short limit order was filled at the range peak at 91.60, and the price action started to fall as expected. Once the price action had moved past the psychologically significant threshold at 90.00, the SL was moved to breakeven.
- This protected the position from snap bullish rebounds, such as the one that occurred shortly afterwards.
- Traders should always manage their positions as they make progress in order to mitigate the underlying risk that they face.
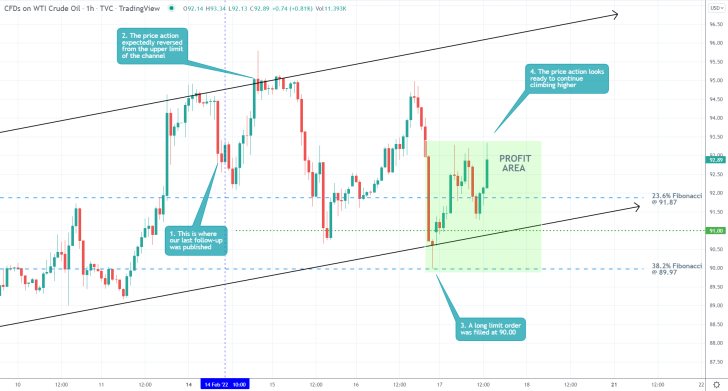
- The expectations of our last crude oil follow-up were realised. An eventual reversal from the upper limit of the channel was extended to the 38.2 per cent Fibonacci retracement level at 89.97, where a long limit order was filled.
- The subsequent rebound from the lower limit of the channel likely signifies the continuation of the underlying uptrend.
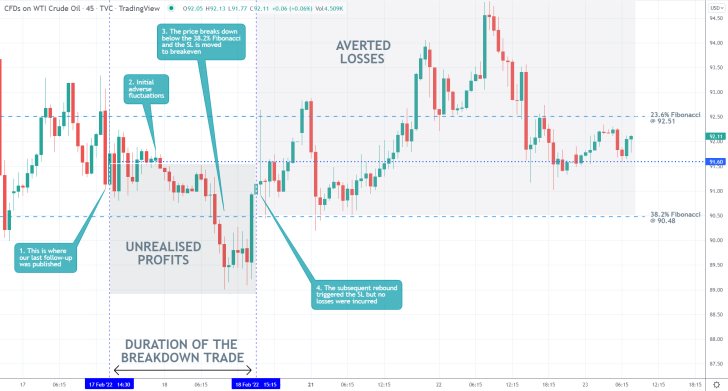
- Even though our last follow-up on crude oil did not generate any profits, the overall execution was quite successful.
- The stop-loss was moved to breakeven once the price action had broken down below the 38.2 per cent Fibonacci retracement level at 90.48, which prevented much bigger losses from the subsequent bullish rebound.
- This is a good example of why traders need to manage their positions and always think about reducing the underlying risk that they face.
Disclaimer: Your capital is at risk! Trading and investing on the financial markets carries a significant risk of loss. Each material, shown on this website, is provided for educational purposes only. A perfect, 100% accurate method of analysis does not exist. If you make a decision to trade or invest, based on the information from this website, you will be doing it at your own risk. Under no circumstances is Trendsharks responsible for any capital losses or damages you might suffer, while using the company’s products and services. For more information read our Terms & Conditions and Risk Disclaimer.


