Silver is one of the most heavily traded commodities in the market. Because of that, it attracts many traders and investors, especially at times when the market is fearful of the ongoing geopolitical events. Due to the uneasiness that was caused by the outbreak of the novel coronavirus in China and has since swept through the global markets, investors sought to move their capitals into low-risk securities such as gold. Such assets at times of panic and fear on the market are considered to be a safe-haven. Even though the pandemic is far from being wholly resolved, the bullish pressure on gold has eased during the last few trading days, which has led some market experts to believe that silver might now catch up, as the overall demand in the commodities market starts to shift. It is for this reason that the current analysis aims to investigate how this anticipated shift in demand in the commodities market could impact the price of silver.
1. Long-Term Outlook:
The price of silver has rebounded from the lower end of a major correction on the weekly chart, as can be seen below. It is currently consolidating in a range between the significant resistance at 18.15 and the significant support at 17.40. It is worth noting that the price has been consolidating just below the former since September 2019. However, it has been unable to break out above it, which is exhibitive of very strong resistance and unlikely continuation of the previous bullish trend. The same can be inferred about the strength of the aforementioned support, which means that the price is more than likely to continue consolidating within the boundaries of set range until the market commitment becomes substantial enough to cause a major breakout in either direction.
The existence of this substantial range between 18.15 and 17.40 is solely based on the observed behaviour of the price action in the last several months. Nevertheless, the Average Directional Index (ADX) has been threading above 25 index points since September 2019, which was the last time that the price managed to close above the significant resistance at 18.15. This means that despite the persistence of the current weekly correction, silver is still technically trending in a bullish market. Hence, it can be inferred that the bulls would be looking to enter long at the dip of the correction in anticipation of the development of the bullish trend. This longer-term bullish sentiment is further confirmed by the Elliott Wave Theory, which postulates that in any trending environment typically there are five impulse waves. Judging by the shape and size of the price action on the weekly chart below, it can be argued that it has already reached a dip at the retracing fourth wave. This means that if the bullish swing is continued, the price would likely attempt to finalise the fifth impulse somewhere above 3.
Additionally, it is fair to assume that if the price manages to successfully break out above the significant resistance at 18.15, which would be the first such attempt since September 2019, the bulls would find even more commitment by the price and would start executing even more long trades. This, in turn, would prompt even higher demand for silver, likely resulting in even more solid bullish upswing.
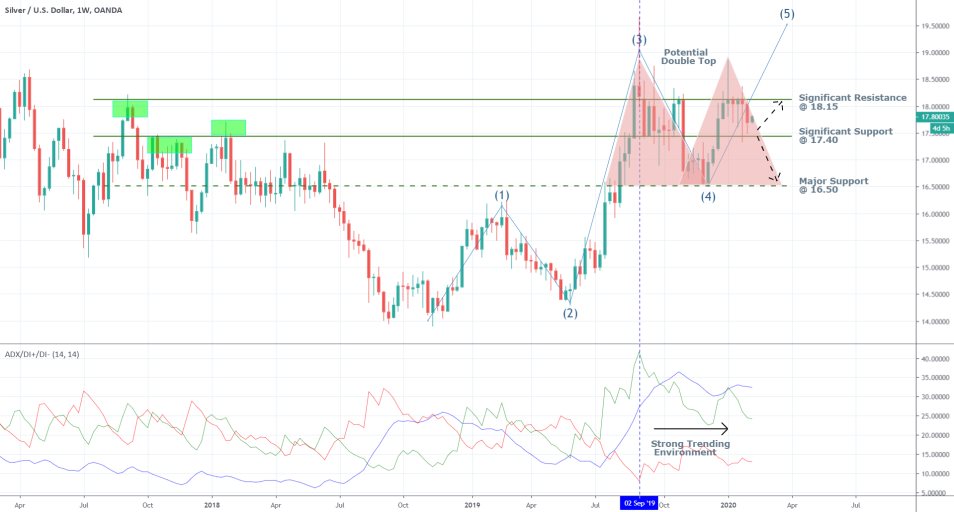
In contrast to the previous assertions, however, is the case that can be made supporting the formation of a long-term bearish downswing. The chief reason that supports such an expectation for a trend reversal in the price of silver is the potential double top pattern that is forming on the weekly chart. Contrarian trades that are opened at the current time would be especially risky; however, if the price manages to break down below the support at 17.40, there would be more evidence to back up the bearish commitment in the market. If that were to happen, then the next pivotal target would be the major support at 16.50. This is where the neckline of a potential double top pattern would be placed, which means that if the price manages to break down below set level, the bearish sentiment on the market would really come to its own and continue establishing an even more substantial downtrend.
2. The Demand Pressures in the Commodities Market:
As it was argued at the beginning of the analysis, some structural changes are likely to occur in demand for precious metals in the foreseeable future. Consider the following chart, which demonstrates the current relationship between the prices of silver and gold:
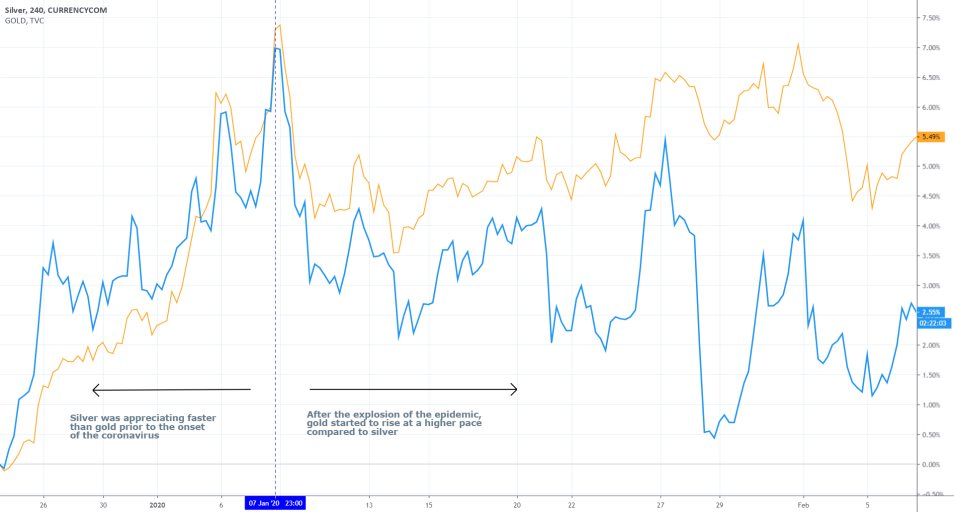
Silver was trading higher compared to gold before the outbreak of the novel coronavirus, but that changed in early January, as investors started getting scared of the potential ramifications of a long-lasting pandemic. That is why there was a sizable easing of the demand for silver in the weak of the virus' outbreak, which was shifted towards gold.
Now, however, investors are becoming wary of a potential glut in the demand for gold as there is not much more spare capacity left for the price to continue appreciating past its current level. That is why it is now likely for some of the bulls to move once again from gold back to silver, which would potentially strengthen the latter’s price past the aforementioned resistance.
The conclusion of Donald Trump's impeachment enquiry has eased the American indices, and as a result of that, the bonds market has monetarily stabilised. With diminished overall uncertainty stemming from such political matters, investors' confidence is likely to be bolstered, which would be favourable for the aggregate demand. All in all, the fundamental conditions on the market favour a likely surge in demand for precious metals, but chiefly the demand for silver.
3. Short-Term Outlook:
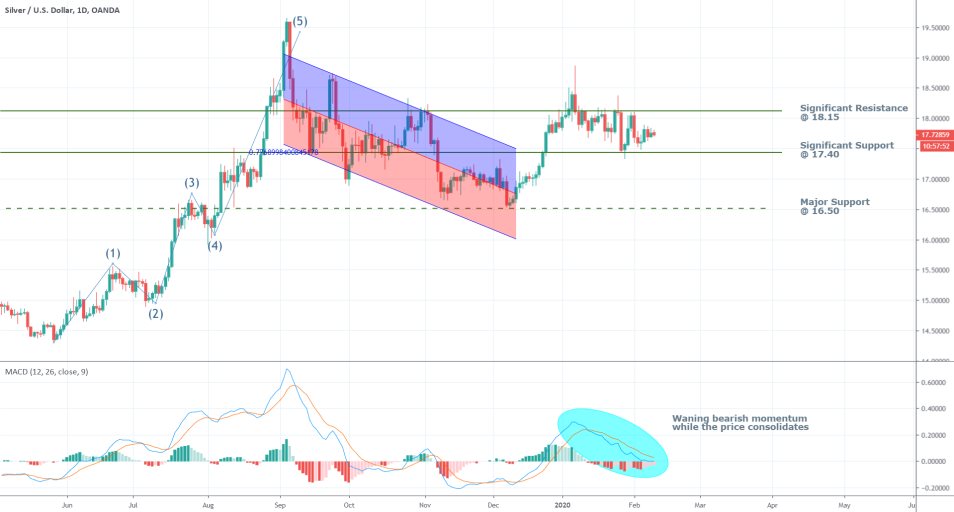
Looking at the chart below, it can be asserted that the aforementioned correction, which was previously observed, is prevailing on the daily chart as well. The potential double top pattern that was noticeable on the weekly chart is no longer so evident here. Instead, it can be argued that the alleged right top of the pattern is simply a wave with a less steep angle, confirming the prevalence of the price correction.
Despite the bearish crossover on the MACD and the negative stochastic chart, the price is trading within a range and is not falling. This means that the bearish momentum, which is currently prevailing, is not very strong. Instead, the price seems to be consolidating tightly, which could be taken as an indication that the previous bullish trend can be extended after the glut in the market is terminated. Said in other words, the price appears to be waiting for more commitment by traders before it continues trading higher.
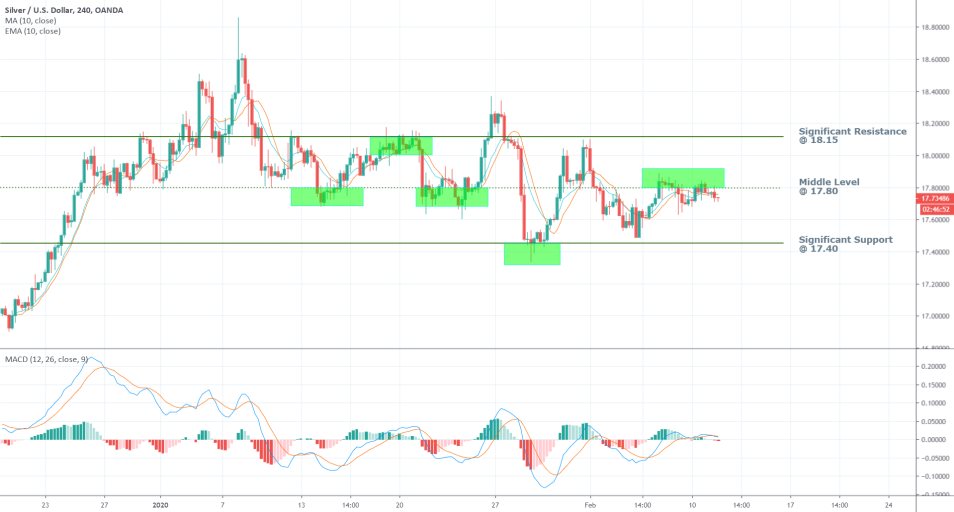
The behaviour of the MACD is even more telling on the 4H chart below. There is no bias in either direction at the current moment, which confirms the previous attestation that the price is currently waiting for more commitment. While this is not especially favourable for the execution of any trades at the current moment, it can reveal where the market would go next as soon as this commitment becomes apparent.
4. Concluding Remarks:
Overall, the price is likely to continue bouncing in a range between the significant resistance at 18.15 and the significant support at 17.40 for the foreseeable future, with the long-term outlook remaining positively bullish. This means that the bulls would be looking for more evidence of that anticipated bullish commitment. One such crucial evidence would be the potential break out above the resistance, in which case the price would continue appreciating towards the first crucial target level – 18.80. Afterwards, the secondary goal would be the previous high at 19.60.
Indicators such as the Stochastic RSI in conjunction with one moving average and one exponential moving average can be used for determining favourable entry levels for range trading within the boundaries of the aforementioned range. However, if the price were to break down below the significant support, the next crucial target level would be the major support at 16.50.
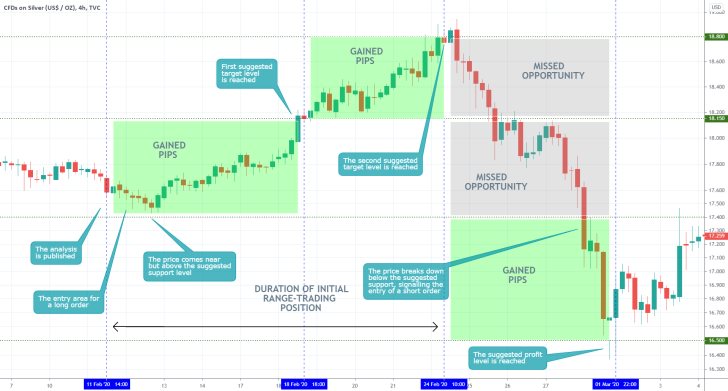
- Two excellent range-trading positions being placed as the price action fluctuated between the range's extremes, as per the analysis' projections. The only thing that could have been done better was the follow-up trade – the short order that was executed way too late (at 17.400). The late entry led to considerable missed opportunities. The biggest takeaway from this setup is that while the underlying price action remains ranging, the trader should look for entries close to the two boundaries of the range. Reversals around these indicate that the price action is likely to remain ranging, while breakouts/breakdowns could potentially signal the termination of the range.
Disclaimer: Your capital is at risk! Trading and investing on the financial markets carries a significant risk of loss. Each material, shown on this website, is provided for educational purposes only. A perfect, 100% accurate method of analysis does not exist. If you make a decision to trade or invest, based on the information from this website, you will be doing it at your own risk. Under no circumstances is Trendsharks responsible for any capital losses or damages you might suffer, while using the company’s products and services. For more information read our Terms & Conditions and Risk Disclaimer.


