The rally of the Nasdaq reached a climax in late November, and ever since then, the price action of the index has been on the retreat. Currently, a minor bullish pullback appears to be developing, which would allow bears to utilise trend continuation trading strategies; chiefly, they would be able to sell the next peak in anticipation of continued price depreciation afterwards.
Tech stocks would likely remain on the retreat in the short term ahead of the next earnings season. Big companies would start reporting towards the end of January, which is likely to cause an upsurge in volatility on the Nasdaq. At least until then, the current prevalence of selling pressure is likely to remain active.
Meanwhile, traders and investors should watch the upcoming inflation data carefully in the U.S., which would be a critical indicator of FED's next course of action regarding monetary policy. According to the preliminary forecasts, inflation growth - of both consumer and producer prices - is expected to fall moderately in December, even though global price pressures remain considerable.
This is likely to bolster the need for a more hawkish policy stance of Jerome Powell and his colleagues from the FOMC, which, in turn, would increase the fallout on stocks. In other words, this week's CPI and PPI numbers in the U.S. would probably drive Nasdaq's correction even lower, which substantiates the primary expectations.
The Current Attempt at a Major Breakdown
As can be seen on the daily chart below, the price action of the Nasdaq is currently probing the lower limit of a major ascending channel, which in itself represents a major bearish indication. Given that this was the first test of this lower limit of the channel over the last several months, it is unsurprising that a minor pullback emerged from it. This, however, does not mean that the dropdown is over.
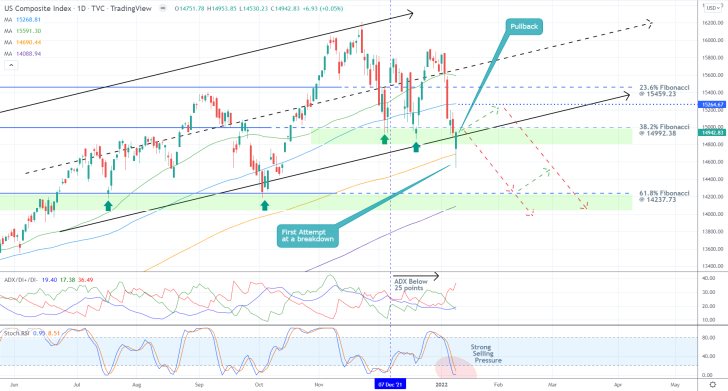
Yesterday's price action opened with a massive gap, though it rebounded from the 200-day MA (in orange). Despite this minor pullback, yesterday's session closed below the 38.2 per cent Fibonacci retracement level at 14992.38. Hence, this Fibonacci threshold has now turned from a major support into a major resistance level. Moreover, its close proximity to the psychologically significant level at 15000.00 makes yesterday's dropdown even more significant.
Given that the lower limit of the channel is currently converging with the 38.2 per cent Fibonacci, the pullback is likely to be terminated around this 15000.00 threshold. Nevertheless, there is also the possibility of a potentially higher pullback extended to the major resistance level at 15264.67, underpinned by the 100-day MA (in blue), before the downtrend can be resumed.
In either case, the next major target for the downtrend would be the 61.8 per cent Fibonacci at 14237.73, which underscores the upper end of the deeper support area (in green). Notice that the 300-day MA (in purple) is currently drawing near it, making it an even more important turning point.
Meanwhile, the ADX indicator has been threading below the 25-point benchmark since the 7th of December, confirming the previous rally's completion. And given the strong selling pressure - demonstrated by the Stochastic RSI indicator - there can be made a very strong case in favour of the continuation of the dropdown further down south.
Measuring Up the Scale of the Temporary Pullback
Yesterday's pullback commenced following the completion of a Hammer candle at the lower limit of the channel, as shown on the 4H chart below. Meanwhile, the 400-day MA (in red) is currently converging with this lower border of the channel.
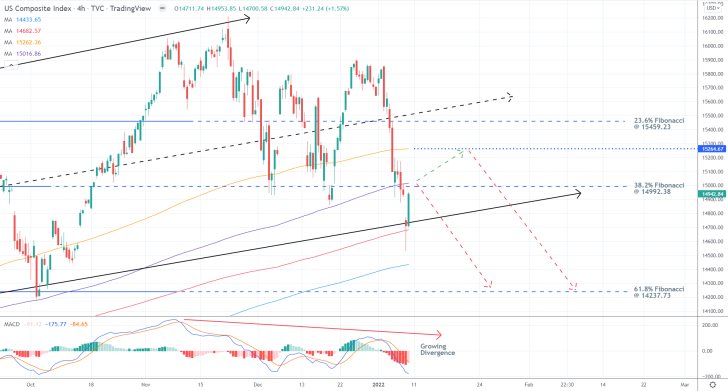
At the same time, the 300-day MA is this time acting as a floating resistance converging with the 38.2 per cent Fibonacci, while the 200-day MA is doing the same with the aforementioned resistance at 15264.67. This makes the two an even likelier turning points for the bullish pullback.
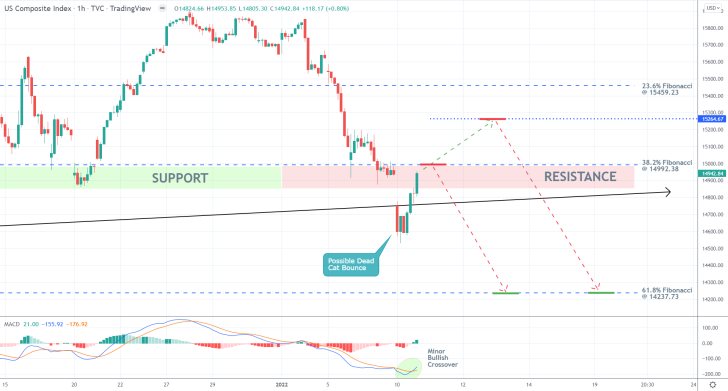
Notice that the MACD indicator is signalling a divergence in the making, which means that the underlying bearish momentum is only likely to increase in the near future. This corroborates the primary expectations. Nevertheless, there was a minor bullish crossover on the MACD, as seen on the hourly chart below.
The current pullback is thus testing the major support-turned-resistance area from below. This bullish pullback is likely to take the form of a Dead Cat Bounce, which is a type of pattern that, when found within a downswing, signifies its probable trend continuation. In other words, all indicators seem to corroborate the expectations for the continuation of the dropdown towards the 61.8 per cent Fibonacci next.
Concluding Remarks
Bears can take advantage of the current set-up in one of two ways, depending on whether the market opens with a massive gap or not later today. They can enter short around the psychologically significant resistance level at 15000.00 or place short limit orders at the major resistance at 15264.67.
In either case, their supporting stop-losses should not be placed further than 100 basis points from their initial entry levels. There is a heightened risk of adverse fluctuations, which means that bears might have to execute several orders before gaining favourable entry. They can then either collect their profits from the 61.8 per cent Fibonacci at 14237.73 or substitute their fixed stop orders for floating TPs in order to catch a potentially deeper dropdown.
Nasdaq's Falling Wedge Close to Completion
The Nasdaq composite has been falling ever since the stock market entered into a corrective mode a few weeks ago. The price action is now drawing near to a major support level where the underlying bearish pressure is likely to be checked. Furthermore, the correction itself appears to be taking the form of a Descending Wedge, which further substantiates the expectations for a bullish rebound.
As regards the fundamental analysis of the index, the recently commenced earnings season, reflecting on the quarterly performance of the biggest U.S. companies in the three months leading to December, could reinvigorate investors' optimism. These expectations are substantiated by the initial data; chiefly, by Morgan Stanley's better-than-expected performance for Q4.
All of this is likely to bolster such a bullish rebound on the price action, which would allow bulls to implement contrarian trading strategies on the current set-up.
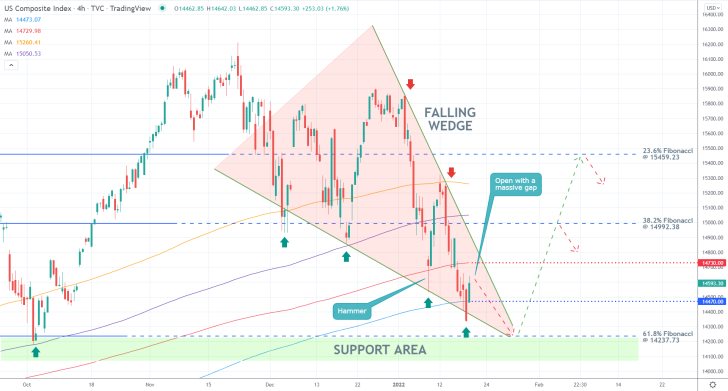
As can be seen on the 4H chart above, the bottleneck of the Wedge is likely to be completed at the 61.8 per cent Fibonacci retracement level at 14237.73 (the aforementioned major support level). The same underscores the previous swing low, representing the upper limit of a major Support Area (in green).
Today's session opened with a somewhat of a misleading positive gap, though the price action remains concentrated within the Wedge. This happened as the price action rebounded from the 500-day MA (in blue), underpinning the major support at 14470.00.
Nevertheless, there is a high probability that this pullback would reverse from the 400-day MA (in red), currently highlighting the major support-turned-resistance at 14730.00. Its significance is further bolstered by the recently developed Hammer candlestick.
That is why arguably, bulls' best chance to take advantage of the set-up would be to place long limit orders at the 61.8 per cent Fibonacci at 14237.73. Their supporting stop-loss orders should not exceed 100 basis pips below their initial entries.
The first target for the renewed uptrend would be the 38.2 per cent Fibonacci at 14992.38. Due to its proximity to the psychologically significant threshold at 15000.00, a minor correction might emerge there. That is why bulls might consider implementing floating TPs once the price action draws near to it.
The next target for the uptrend would be the 23.6 per cent Fibonacci at 15459.23.
Could the Robust Earnings Season Cause a Rebound on the Nasdaq?
The recent selloff in the stock market drove the price action of the Nasdaq towards the psychologically significant support level at 13000.00. However, the robust earnings season in the U.S. could bring an end to the correction. This is especially substantiated by the fact that tech stocks have consistently beaten Wall Street's forecasts over the past couple of weeks. This trend is expected to carry over into this week as well.
Traders and investors would be watching the behaviour of the price action around the current level carefully because it is positioned in a major make-it-or-break-it area, which could spell the difference between the continuation of the downtrend or the emergence of a bigger bullish pullback.
If the price action breaks higher in the next several hours, bulls would be able to implement contrarian trading strategies. Conversely, bears would be able to utilise trend-continuation trading strategies provided that a decisive reversal occurs next.
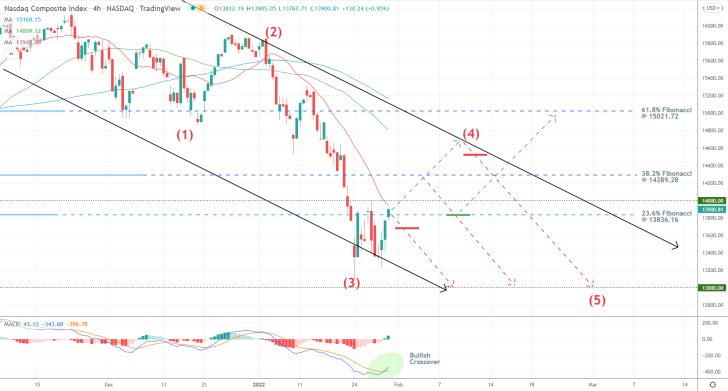
As can be seen on the 4H chart above, the downtrend appears to be taking the form of a 1-5 impulse wave pattern, as postulated by the Elliott Wave theory. For the time being, the second impulse leg (2-3) seems to be rebounding from the lower limit of the descending channel and the psychological support at 13000.00. This could imply the likely beginning of the second retracement leg (3-4) towards the channel's upper border.
The likelihood of such a bullish correction is further underscored by the MACD indicator, as the 12-day EMA (blue) crossed above the 26-day EMA (blue) recently. Meanwhile, its histogram started rising over the last several hours, underlining an upsurge in bullish momentum.
The first challenge for such a bullish correction is represented by the 23.6 per cent Fibonacci retracement level at 13836.16. Its strength as a prominent turning point is further underscored by the fact that the 20-day MA (in red) is currently converging with it. Moreover, the psychologically significant threshold at 14000.00 is also nearby.
The second obstacle for the pullback would be the 38.2 per cent Fibonacci at 14289.28, whereas the 50-day MA (in green) and 100-day MA (in blue) are currently running parallel to the upper limit of the descending channel.
Less risk-averse bulls may consider entering long just above 14000.00, though they should keep in mind that this would entail a high degree of risk. That is why their supporting stop-loss orders should be placed just below the 23.6 per cent Fibonacci. Alternatively, they could enter long at 13836.16 following a potential reversal from the 38.2 per cent Fibonacci.
Bears, in contrast, could enter short either just below the 23.6 per cent Fibonacci (around 13700.00) or near the upper limit of the channel (around 14500.00). In either case, their supporting SLs should be placed no more than 100 basis points above their initial entries.
Bulls and bears alike could implement floating TPs right from the get-go in order to negate the impact of the underlying adverse fluctuations.
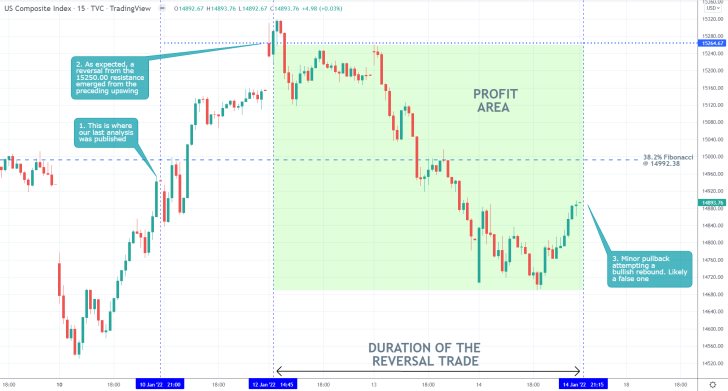
- The expectations of our last Nasdaq analysis for a reversal from the 15264.67 were realised.
- Following the decisive reversal from this major threshold, the subsequent dropdown penetrated below the psychologically significant 38.2 per cent Fibonacci retracement level at 1499238.
- The currently emerging minor pullback could potentially test the underlying bearish commitment in the market.
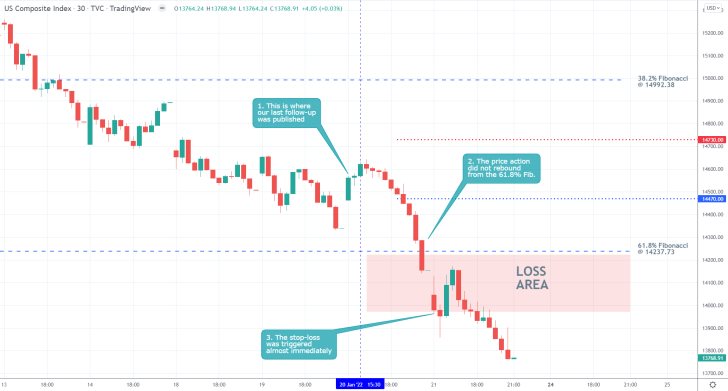
- Shortly after the release of our last follow-up analysis of the Nasdaq Composite index, the price action dropped to the 61.8 per cent Fibonacci retracement level at 14237.73.
- However, no bullish rebound occurred there, and the price action continued to fall. A small loss was incurred after the price action reached the narrow stop-loss order, which was placed just 100 basis points below the initial entry.
- That is why it is so risky to attempt to 'buy the dip' at a time when the stock market is in freefall.
Disclaimer: Your capital is at risk! Trading and investing on the financial markets carries a significant risk of loss. Each material, shown on this website, is provided for educational purposes only. A perfect, 100% accurate method of analysis does not exist. If you make a decision to trade or invest, based on the information from this website, you will be doing it at your own risk. Under no circumstances is Trendsharks responsible for any capital losses or damages you might suffer, while using the company’s products and services. For more information read our Terms & Conditions and Risk Disclaimer.


