Since the initial market crash from the coronavirus crisis concluded, various market experts and commentators have started to weigh in on the likely scope of the subsequent correction. Chiefly, they wanted to discern whether set correction is going to turn out to be a minor retracement in an otherwise bearish market, or if it could signify the beginning of a renewed bullish run.
Since those early days of the turmoil's aftermath in late-March, the S&P 500 index has been continually advancing and is currently a little more than 300 points away from reaching the pre-crisis peak. It is now more than evident that this substantial rebound is something more than a minor correction; however, this does not necessarily mean that the current bullish run would continue advancing indefinitely.
That is why the purpose of today's analysis is to examine the shape and size of the S&P 500's ongoing bullish trend in the context of the present transitionary stage of the broader recovery process.
1. Long-Term Outlook:
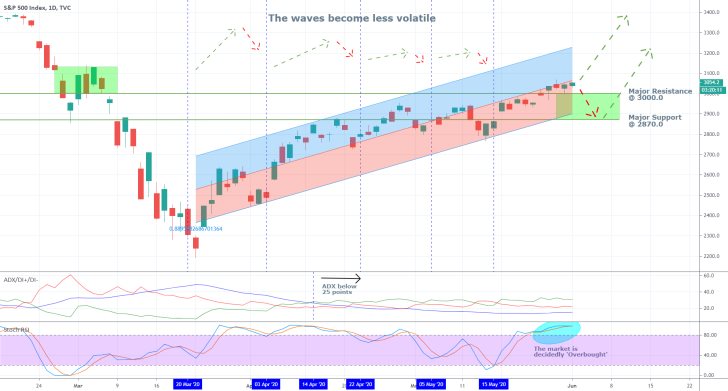
As can be seen on the daily chart below, the newly developing paradigm of the underlying recovery process, which has already been observed in the FX market, the commodities market, and others, is also affecting the price action of the S&P 500.
The underlying volatility during the early stages of the recovery process was much more significant compared to what is presently seen. From the 20th of March to the 3rd of April, and then from the 3rd of April to the 14th of April, the price action developed massive and sudden swings in both directions. This gave credence to the expectations for a forthcoming conclusion to what was perceived at the time as a minor bullish correction.
However, as time passed, the underlying volatility diminished, and consequently, the size of the corresponding price waves started to lessen. This behaviour of falling volatility means that the bullish run is not a mere speculative bubble and that there is an intrinsic value to it. This, in turn, supports the assertion that the apparently evolving bullish market is here to stay. In other words, the price action is likely to continue trading higher as the market believes in the sustainability of the ongoing recovery process.

In contrast to these observations, the ADX continues threading below 25 points. This means that the underlying price action is range-trading, albeit in a bullish market. It is advancing at a moderate pace. This behaviour favours the establishment of minor bearish downswings in the otherwise bullish market.
As can be seen, the Stochastic RSI is threading way into the 'Overbought' extreme, which coupled with the reading of the ADX, could compel some traders to bet on the emergence of a new bearish correction.
The price action continues to advance just below the middle line of the ascending channel, which underscores the existence of selling pressure in the market. The latter could potentially force the development of such a bearish correction. If this were to happen, then the price action could fall either to the channel's lower boundary or the major support level at 2870.0, before it gets terminated.
The major support level at 2870.0 is positioned at 130 basis points away from the crucially important support level at 3000.0, which bears tremendous psychological importance. The last time the price action penetrated the former was in early-March when the breakdown was followed by a false retracement back above the 3000.00 mark, which equalled precisely 130 points. Similar behaviour can be expected now since the price action managed to break out above the major support level (Previously resistance) at 3000.0 several days ago.
2. Short-Term Outlook:

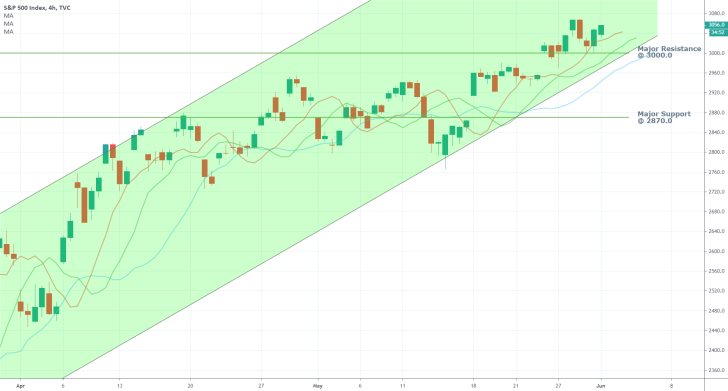
As can be seen on the 4H chart above, there is another ascending channel built on a smaller timescale. The price action is threading close to the channel's lower boundary, which could be an early sign of depleting bullish commitment in the market. This happens shortly after the S&P broke out above the psychologically important 3000 mark, which means that the price of the index currently finds itself at a critical junction.
The three Moving Averages – the 13-day MA (blue), the 8-day MA (green), and the 5-day MA (red) – are currently in ascending order. This underlines the prevalence of the bullish sentiment. However, if the underlying relationship between the three MAs is broken, this would clear the way for the formation of a bearish correction.
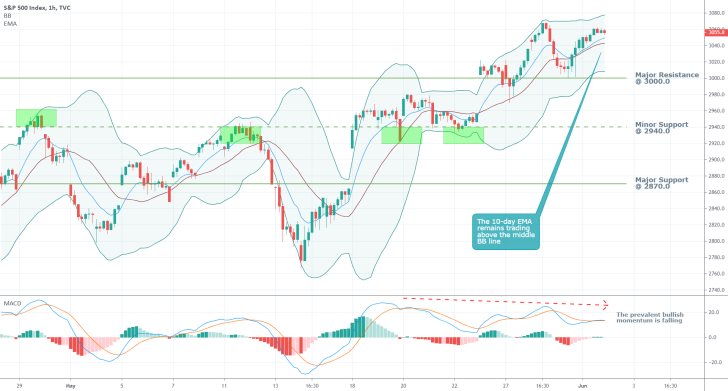
The MACD on the hourly chart below continues to demonstrate the robust bullish momentum; however, the decreasing waves of the indicator underline the potential exhaustion of this trend. In other words, the MACD represents early indications that the bullish momentum, albeit remaining quite solid, could be losing steam. This, in turn, could support the formation of a short-term bearish correction.
Such expectations are going to be confirmed if the 10-day Exponential Moving Average (EMA) manages to break down below the middle line of the Bollinger Bands.

3. Concluding Remarks:
Overall, there is compelling evidence suggesting that the S&P 500 has indeed resumed trading in a bullish market, similar to the pre-crash period. The global economy appears to have survived the initial shock from the pandemic, and there are indications suggesting that the breadth of the overall economic hit is not as severe as initially feared. This would likely support the continuation of the current rally's development.
Nevertheless, there are also reasons to expect the formation of a minor bearish correction, particularly following the recent breakout above the crucially important resistance level at 3000.0.

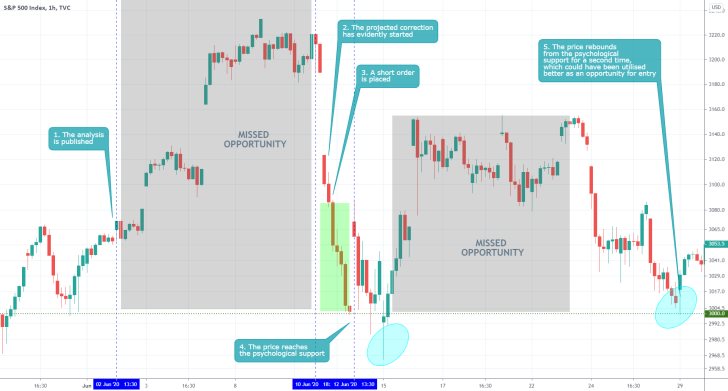
- The analysis quite rightly argued that the market is sending mixed signals without having a prevailing sentiment. It should, however, have stressed the need for traders to stay away from such undetermined setups. It is better to refrain from trading rather than trade the uncertainty. Even still, it was well that the analysis underpinned the psychologically significant support at 3000.00, as the expectation for the formation of a correction to it was ultimately realised.
Disclaimer: Your capital is at risk! Trading and investing on the financial markets carries a significant risk of loss. Each material, shown on this website, is provided for educational purposes only. A perfect, 100% accurate method of analysis does not exist. If you make a decision to trade or invest, based on the information from this website, you will be doing it at your own risk. Under no circumstances is Trendsharks responsible for any capital losses or damages you might suffer, while using the company’s products and services. For more information read our Terms & Conditions and Risk Disclaimer.


