Apple's share price has been on the rise since our previous analysis of the technological giant's performance, and it is currently nearing a crucial test level for the bullish commitment in the market. The price action is coming closer to the historical resistance level at 325.00, and a break out above it would mean a breakout into uncharted territory further north.
Nevertheless, due to the significance of this resistance level, it could also turn out to be a major trend reversal point for the underlying direction of the price action. This has already happened once before, whence the price action went on to form a new substantial bearish trend. Hence, over the next several days, traders are going to be looking intently for signs of weakness in the underlying bullish sentiment, potentially signifying the end of the prevailing bullish run and the formation of a subsequent dropdown.
That is the reason why in today's analysis, we are going to analyse the behaviour of Apple's share price and delineate on the most likely future for the multinational conglomerate's stock.
1. Long Term Outlook:
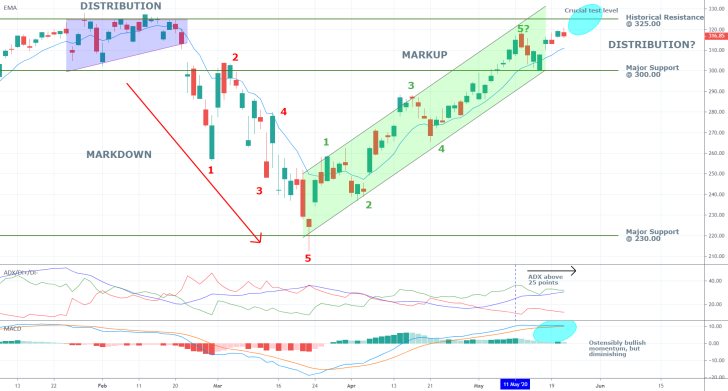
As can be seen on the daily chart below, the current market price is trading at around 316.00, which is just below the historical resistance at 325.00. This is what gives prominence to the expectations for a potential trend reversal around the current level. This is especially true given the fact that the historical resistance served as an upper boundary for the last Distribution range, which was represented by a wedge pattern. Hence, a potential trend reversal around the current market price could lead to the establishment of a new major bearish trend, just like the last time.

Breaking out above the 325.00 threshold is going to be difficult, given the expectations for the execution of multiple selling orders around it by contrarian traders, which, in turn, is likely going to result in the accumulation of substantial selling pressure there. Nevertheless, if a breakout does indeed form, this is going to represent a significant indication for the existence of strong bullish sentiment in the market. Consequently, the price action is going to venture further north into uncharted territory, which is going to render the execution of technical analysis in the future more difficult.
If the price action fails to break out above the 325.00 mark, it could consolidate within a new Distribution range with a lower boundary represented by the major support level at 300.00, which also has psychological importance. This level's prominence was confirmed during the establishment of the preceding bearish trend whose 1-2 retracement leg peaked around the 300.00 level.
As regards the Elliott Wave Theory, it can be seen that so far the currently evolving bullish 1-5 impulse wave pattern is almost concluded. It only has to finalise the last impulse leg (4-5), which might have already been done. This gives more credence to the expectation for a possible trend reversal, as the bullish 1-5 pattern could be followed by a new consolidation range (the new Distribution).
The ADX has recently surpassed the 25-point mark, which means that the market is currently trending. Consequently, the underlying environment favours the continuation of the bullish trend's establishment above the 325.00 resistance level.
The MACD is also demonstrating that the underlying momentum remains ostensibly bullish, which, too, is inlined with the expectations for a break out above the aforementioned resistance. Nevertheless, it should also be acknowledged that the bullish momentum is presently diminishing, which could lead to a change in the short term. In case that the bearish momentum surges in the short term, this could impede the bullish trend's attempts at a breakout, and subsequently to lead to a trend reversal.
2. Short Term Outlook:

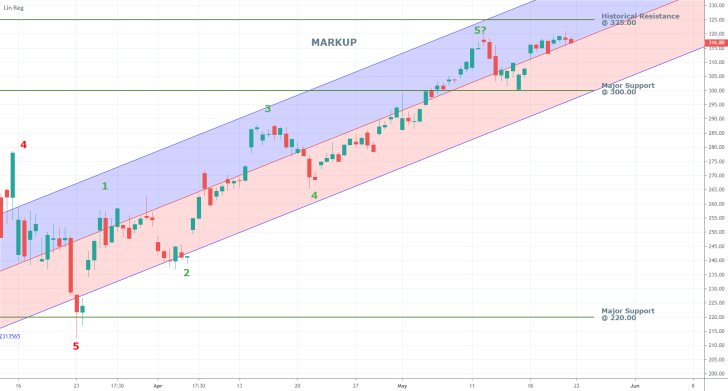
As can be seen on the 4H chart above, the price action is currently threading just above the ascending channel's middle line, which is serving as an intermediate support level. Hence, a break down below it is going to underscore the build-up of bearish commitment in the market and thereby lessen the possibility for the formation of a breakout above the historical resistance.
Such a breakdown is not necessarily going to confirm the termination of the prevailing bullish trend, but it could still underline the transition of the market into a minor intermediate consolidation range before the price action can continue heading further north.
Meanwhile, the ascending channel's lower boundary has just converged with the psychologically important major support level at 300.00, which means that a potential breakdown below the two is now less likely.
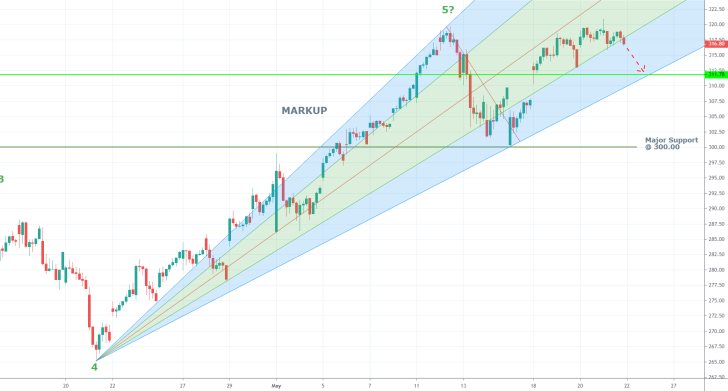
As can be seen on the 1H price chart below, the price action is currently contained within the middle segment of the pitchfan tool, which is ideal for the continuation of the bullish trend's development. Nevertheless, even if the price action falls below it, this is not necessarily going to signify the exhaustion of the underlying buying pressure.
As is represented below, in the short run, the price action can fall to the pirchfan's lower boundary at around 311.78 before it finds the necessary support.

3. Concluding Remarks:
Overall, Apple's share price looks ready to test the strength of the historical resistance level at 325.00. A breakout above it is going to represent a strong signal for market bulls to step up and join the existing trend. Conversely, a failed breakout and subsequent reversal is likely going to result in the emergence of a new Distribution range. This, in turn, is going to provide contrarian traders with an opportunity to execute more selling orders on the expectation for the development of a new bearish trend.
Disclaimer: Your capital is at risk! Trading and investing on the financial markets carries a significant risk of loss. Each material, shown on this website, is provided for educational purposes only. A perfect, 100% accurate method of analysis does not exist. If you make a decision to trade or invest, based on the information from this website, you will be doing it at your own risk. Under no circumstances is Trendsharks responsible for any capital losses or damages you might suffer, while using the company’s products and services. For more information read our Terms & Conditions and Risk Disclaimer.


