One of Wall Street's favourite blue-chip companies is scheduled to report its quarterly performance next and traders' anticipation is unsurprisingly building up. Apple is expected to deliver its earnings report tomorrow after the market close, which means that its impact would be reflected on Thursday's open.
According to the consensus forecasts, Apple is projected to report Earnings Per Share of $1.39 for the three months leading to December. If realised, this would be the company's best performance, surpassing the previous EPS record of $1.25 in Q4 of 2019. Unsurprisingly, such a performance during a global pandemic would likely be perceived as a potential catalyst for continued price appreciation.
One of the most important metrics to watch for in Apple's report is services revenue. The Silicon Valley giant has been attempting to diversify its revenue streams for more than a year now, which is why the revenue from services, such as iTunes, Apple TV+, and Apple podcasts, is so important for the company, which strives to become less dependent on sales generated mostly from products.
Given that market experts expect Apple to post its strongest revenue services growth in five quarters, all of the underlying fundamental factors seem to be aligning positively for the company. Consequently, its share value is very likely to appreciate in the following days. But what can be ascertained about the stock given its current technical outlook?
1. Long-Term Outlook:
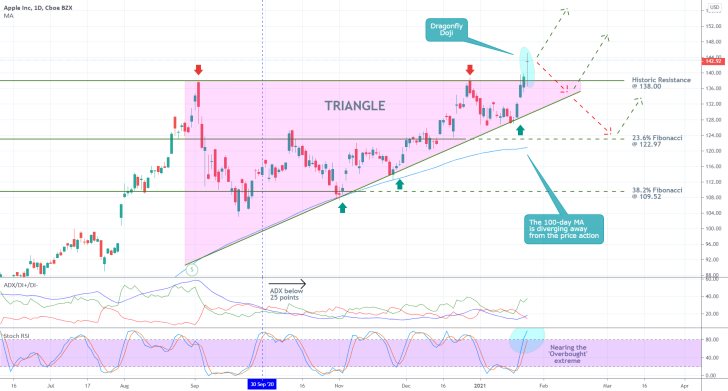
As can be seen on the daily chart below, Apple's share price is currently attempting to break out above the upper boundary of a major Triangle pattern. The pattern itself typically represents a trend continuation structure found within an existing bullish trend. In other words, a decisive breakout above the historic resistance at 138.00 would very probably entail the continuation of the current bullish trend into uncharted territory. However, yesterday's attempt at such a breakout does not yet seem all that certain.
The price action has already failed to break out above the historic resistance on two separate occasions, and yesterday's candle represents a Dragonfly Doji. This particular type of candle is frequently found at the lower end of a downtrend, which is why it is taken to indicate an upcoming bullish reversal. However, its bullish sentiment is less clear-cut when the candle emerges at an all-time high.
While the Dragonfly Doji could very well indicate the likely continuation of the price action further north, its massive lower shadow could instead underpin the existence of uncertainty in the market. Consequently, yesterday's breakout could pan out to be yet another failed attempt as the price action retraces back within the boundaries of the Triangle. Arguably, the worst-case scenario for the bulls entails a potential dropdown to the 23.6 per cent Fibonacci retracement level at 122.97 before the uptrend is continued.

On the one hand, the Triangle's lower border has already been tested on three separate occasions (as highlighted by the green arrows), which is enough for a successful breakout higher. Meanwhile, the price action is diverging away from the 100-day MA (in blue), which is demonstrative of rising bullish bias in the short-term.
On the other hand, the ADX indicator has been threading below the 25-point benchmark since the 30th of September, which means that the development of a Triangle pattern has changed the underlying market sentiment. Such ranging environments are accommodative to price fluctuations and failed breakouts, which represents a case against further price appreciation above the historic resistance any time soon.
Finally, the Stochastic RSI indicator is nearing it's overbought' extreme, which on its own does not necessarily underline an immediate bearish reversal; however, it could prompt more bearish pressure around the current market price.
2. Short-Term Outlook:
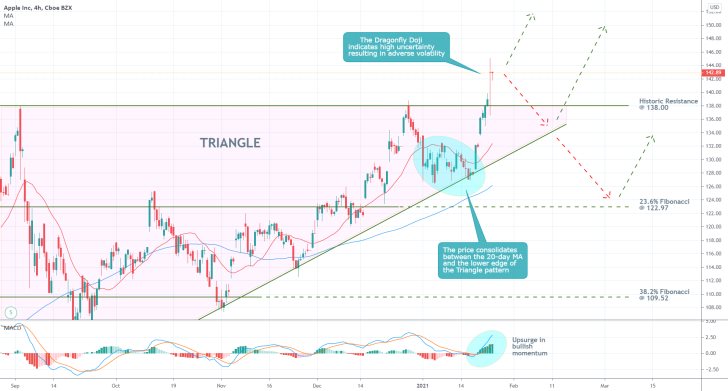
The behaviour of the price action on the 4H chart below is more bullishly-oriented than it seemed on the daily chart. After a minor consolidation between the Triangle's lower boundary and the 20-day MA (in red), the price action surged to break out above the pattern last Friday. This behaviour is also demonstrative of rising buying pressure in the short-term.
The MACD indicator, in turn, is underpinning this sudden upsurge in bullish momentum. It remains to be seen whether the indicator's 26-day EMA reaches above the previous wave's peak, which would underscore stable bullish momentum as opposed to momentary uptick.

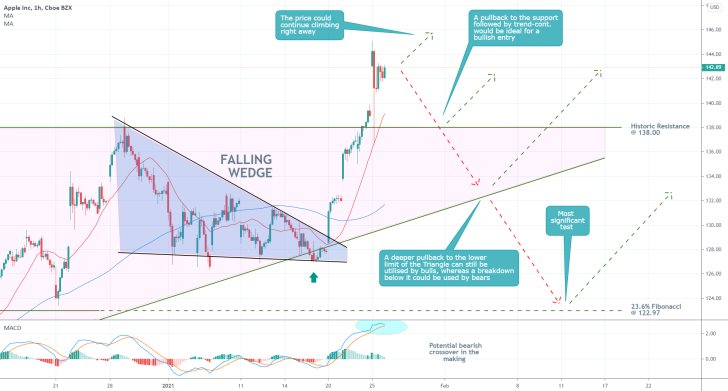
Notice that shortly before the aforementioned breakout occurred, the price action had completed a Falling Wedge pattern, as shown on the hourly chart below. Falling wedges also commonly signify increasing bullish sentiment, which is evocative of potential hikes in the near future. This is also substantiated by the fact that yesterday's price action rebounded from the 20-day MA, which serves as a floating support.
Market bulls who do not have open buying positions are advised not to enter long at the current price because they have already missed favourable entry before the latest upswing (lowest part of the Falling Wedge). They can instead wait and see if the price pulls back to the historic resistance (currently serving as support) without breaking down below it. This would allow them to use trend-continuation trading strategies and go long at the temporary dip.
Depending on the underlying bearish pressure over the next couple of days, such a momentary pullback could dig deeper to either the Triangle's lower limit or the 23.6 per cent Fibonacci at 122.97. Hence, bulls should keep in mind that ill-timed and poorly executed long orders face the risk of the price falling anywhere between the historic resistance at 138.00 and the 122.97 support.
In contrast, even though bears could use contrarian trading strategies in anticipation for such a pullback, they are advised not to do so because the overall risk they would be facing seems unjustified given the strong bullish biases at present.

3. Concluding Remarks:
Traders should keep in mind that even though the prevailing market forecasts expect Apple to post solid quarterly data, earnings releases tend to cause heightened volatility, which is not ideal for highly risk-averse traders. Moreover, the possibility for erratic price fluctuations in the hours leading up to the report's release could make trade execution highly imprecise. That is why traders need to determine whether these conditions are suitable for trading according to their personal preferences.

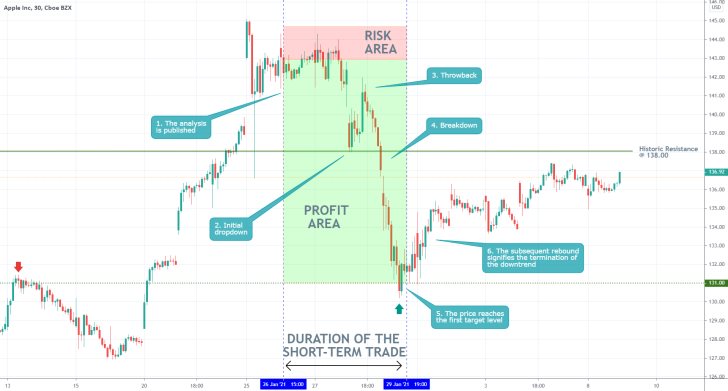
- The forecasts of the analysis were only partly realised. A bearish correction did indeed occur and the price slipped to the first target level at 131.00, but the correction was terminated there without falling any further.
- The rebound from the 131.00 support signifies the termination of the bearish correction.
Disclaimer: Your capital is at risk! Trading and investing on the financial markets carries a significant risk of loss. Each material, shown on this website, is provided for educational purposes only. A perfect, 100% accurate method of analysis does not exist. If you make a decision to trade or invest, based on the information from this website, you will be doing it at your own risk. Under no circumstances is Trendsharks responsible for any capital losses or damages you might suffer, while using the company’s products and services. For more information read our Terms & Conditions and Risk Disclaimer.


