Since our previous analysis of platinum, the commodity's price action has depreciated by more than 100 dollars per troy ounce, in congruence with our projections. A new downtrend has evolved within the rough boundaries of a descending channel, which represents a major retracement from the previous bullish trend.
In light of the recently observed indications suggesting a potential reversal in the underlying direction of the price action may be coming, the initial bullish trend followed by the descending channel starts to resemble a bullish flag pattern. If the underlying bearish sentiment has indeed been exhausted, then such a development could represent a trend continuation pattern. In other words, it could give market bulls the sign they have been waiting for, to join the market once again by going long.
Therefore, the purpose of today's analysis is to examine the behaviour of the price action and to discern whether or not the bearish channel has already been concluded. If so, what are the crucial levels of support and resistance to look for as the potentially renewed bullish sentiment begins to drive the price of platinum higher?
1. Long-Term Outlook:
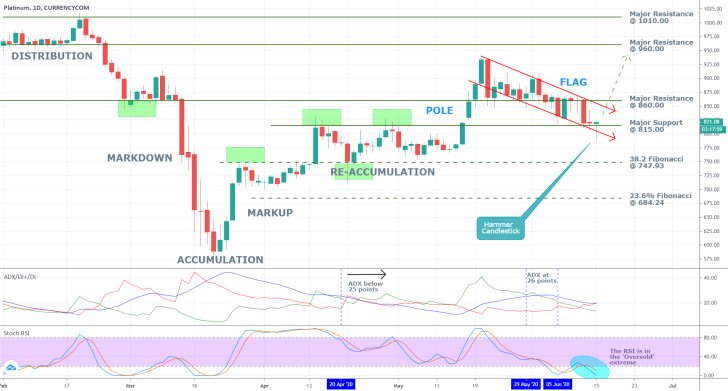
As can be seen on the daily chart below, the Markup and the Re-Accumulation comprise the broader 'Pole' of the aforementioned bullish flag pattern. The descending channel outlined by the two red trend lines illustrates the 'flag' itself. Given the formation of yesterday's hammer candlestick, which itself represents a bullish signal, and the price action's apparent inability to break down below the channel's lower boundary, the new bullish upswing is expected to originate from the major support level at 815.00.
It would then have to break out above the channel's upper edge and also above the major resistance level at 860.00 so that the bullish sentiment's prevalence could be confirmed entirely. Afterwards, the first significant target level for the renewed bullish trend would be encompassed by the major resistance level at 960.00, which served as the lower boundary of the previous Distribution.
Notice that if the price action does indeed manage to break out into this area, the selling pressure there will prove to be much more significant. This is partly due to the fact that it prompted the emergence of the last Markdown, and partly because it comprises the psychologically important 1000.00 price level. The latter could prove to be a significant impediment for the continued development of the new Markup, and a potential turning point for the price action's underlying direction.
If, however, the bullish flag pattern is not realised and the descending channel is instead continued, the first notable target level would be the 38.2 per cent Fibonacci retracement level at 747.93.

Notice also that with the notable exception of the period between the 29th of May to 5th of June, the ADX has been threading below the 25-point mark since the 20th of April. This means that the market is ostensibly range-trading, but there have been recent attempts for the underlying sentiment to become trending. All of this is inlined with the main assertion regarding the anticipated termination of the flag, and the subsequent advancement of the market further north.
The Stochastic RSI is currently in the 'Oversold' extreme, while the price action has been consolidating over the last several days. This creates favourable conditions that could be exploited by contrarian traders. In other words, less risk-averse traders are likely to seize the opportunity by buying in into the market, on the expectations for a change in the underlying direction of the price action. Such behaviour, in turn, would bolster the demand for platinum, thereby driving the price higher.
2. Short-Term Outlook:
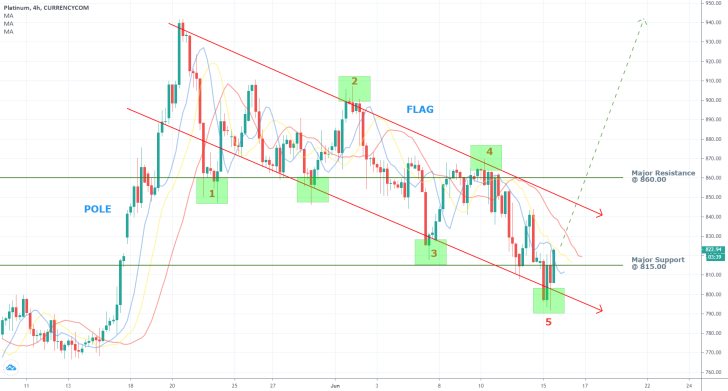
As can be seen on the 4H chart below, a breakdown of the price action's behaviour within the boundaries of the descending channel reveals that the flag is also an impulse wave pattern, as postulated by the Elliott Wave Theory. Given that the 4-5 impulse leg has evidently already bottomed out, this supports the previous expectations for a rebound in the direction of the price action. In other words, there is now even more evidence suggesting that the recent bearish downturn has already been exhausted and that the market might be preparing to resume trading higher.
Notice also that the price action has concluded a false breakdown below the major support level at 815.00, which gives additional credence to the primary postulation. The snap rebound that was initiated from the channel's lower boundary, and subsequently drove the price action above the support level, represents a significant indication that the underlying bearish sentiment is running out.

The only remaining evidence to the contrary is encapsulated by the relationship of the three Moving Averages with each other. The 5-day MA (in blue) remains below the 8-day MA (in yellow), which remains below the 13-day MA (in red). This descending order underpins the bearish sentiment in the market, which inspired the emergence of the 1-5 impulse wave pattern. However, if this order gets terminated in the following hours and days, this would be yet another indication of rising bullish sentiment.
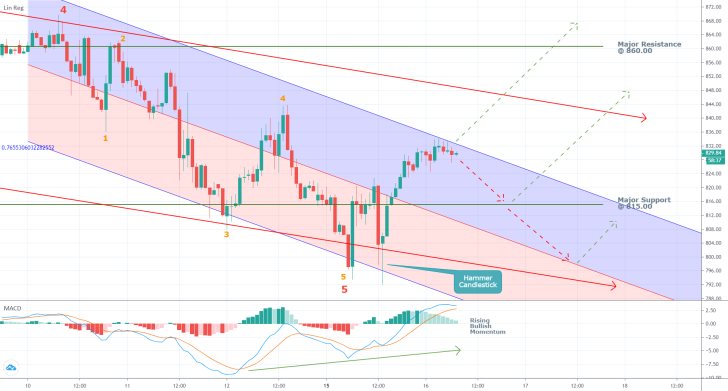
The final 4- 5 impulse leg of the broader 1-5 pattern is represented as a minor descending channel in the very short term on the hourly chart below. The price action is currently consolidating below the channel's upper boundary despite the rising bullish momentum, as seen on the MACD. This means that a minor bearish retracement might be due to occur before the broader bullish upswing can resume developing.
Three possible scenarios for future development are demonstrated on the chart below, depending on whether or not such a bearish correction does indeed emerge. Subject to the likely scope of such a correction, the price action could reach one of two potential swing lows before the broader bullish uptrend can be resumed.

3. Concluding Remarks:
There is plenty of evidence confirming the likely trend continuation pattern that is presently emerging on platinum's price action. The confluence of indicators, all of which point to the very probable development of a new Markup, is a solid reason for market bulls to be excited. However, they should not rush to execute long orders prematurely, as a minor bearish correction could develop first in the very short term.

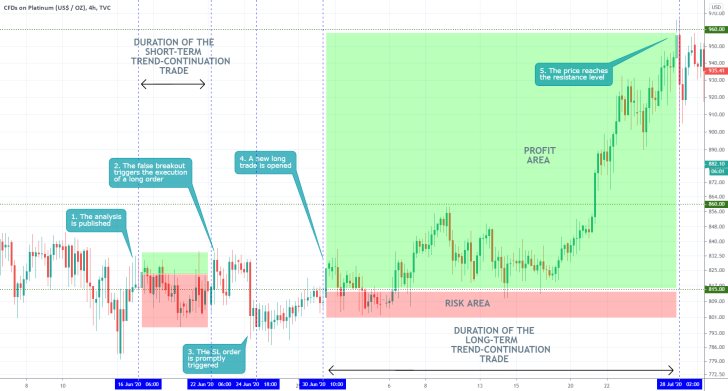
- The analysis did an excellent job of interpreting the underlying evidence. It longer-term projections were realising, including the completion of the flag pattern. Even the short-term anticipations concerning the development of a minor bearish correction were justified.
Disclaimer: Your capital is at risk! Trading and investing on the financial markets carries a significant risk of loss. Each material, shown on this website, is provided for educational purposes only. A perfect, 100% accurate method of analysis does not exist. If you make a decision to trade or invest, based on the information from this website, you will be doing it at your own risk. Under no circumstances is Trendsharks responsible for any capital losses or damages you might suffer, while using the company’s products and services. For more information read our Terms & Conditions and Risk Disclaimer.


