American stocks ceased depreciating last week after the FED released positive data concerning the 2020 stress tests. According to the Board of the Federal Reserve, most US banks have enough liquidity to weather even deeper economic slumps. This means that the overall financial framework in the country can withstand the economic ripples that are to be expected if a second coronavirus wave hits the markets.
Meanwhile, the robust performance of the Chinese industry that was recorded in June entails solid global recovery, which is also likely to bolster investors' confidence. This, in turn, is a necessary prerequisite for the sustained advancement of the US stock market.
Finally, the consensus forecasts projecting growth in US employment for the current month, are also likely to contribute to the strengthening of the stock market. Hence, the purpose of today's analysis is to examine the presently developing setup on the S&P 500 and to delve into the possible ways in which these fundamentals are likely to strengthen the price action of the index.
1. Long-Term Outlook:
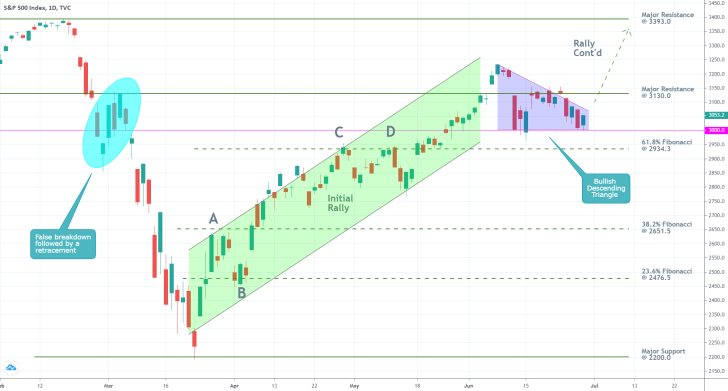
As can be seen on the daily chart below, the recent stock market rally was temporarily suspended, and a descending triangle pattern is currently emerging.
If the price action manages to break out above the descending trend line, which comprises the triangle pattern, a new rally is likely to drive the underlying price action towards the major resistance level at 3393.0. Before this can happen, however, the price action would also have to break out above the major resistance level at 3130.0.
It is especially important to point out the fact that the prominent 3000.0 support level represents the triangle's lower boundary. Due to the psychological significance of this level, which is quite substantial, the support there is also a prominent turning point. Hence, the expectations for a continued rally once the descending triangle pattern is concluded are further substantiated by the fact that the price action is currently consolidating above the psychological support.
It follows that the descending triangle pattern is a sort of a retracement to that psychological support, which precedes the establishment of a new uptrend. This is quite reminiscent of the last time the price action fluctuated around the 3000.0 level in a similar fashion (look at the blue sphere on the chart below).

Nevertheless, the continuation of the bullish market's development should not be taken for granted. A breakdown is still possible, which could be followed by the establishment of a new bearish trend. This would happen if the underlying fundamental factors were to change suddenly and unexpectedly.
The first possible target level for such a dropdown is encompassed by the 61.8 per cent Fibonacci retracement level at 2934.3, though this level is also the last potential turning point. In other words, this is the lowest level that the price action could fall to and still revert itself north.
Meanwhile, if the situation turns severe and the price action breaks down below the aforementioned support, the next target level would be the 38.5 per cent Fibonacci retracement at 2651.5. The significance of the three Fibonacci levels is illustrated by points A through D. As can be seen, the underlying price action tends to rebound each time it nears one of them, which presupposes heightened volatility around these crucial junctures.
2. Short-Term Outlook:
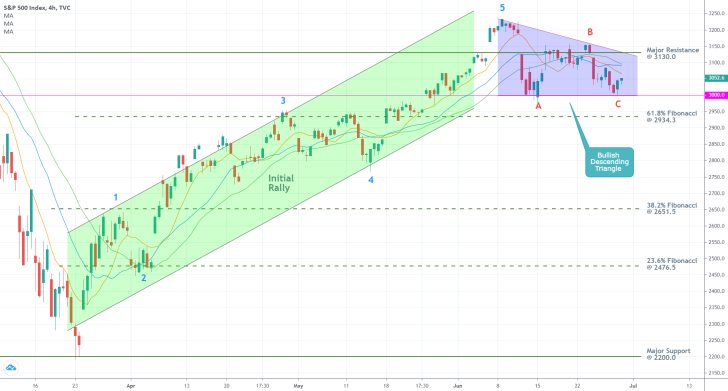
As can be seen on the 4H chart below, the current behaviour of the underlying price action can be elucidated using the Elliott Wave Theory. The initial rally represents one broad 1-5 impulse wave pattern, which was concluded after the price action reached a new peak at point 5. The following descending triangle, which encapsulates a corrective ABC pattern, therefore, represents a logical continuation to the previous bullish trend.
As regards the Elliott Wave Theory, the underlying conditions are favourable for the continuation of the bullish rally once the price action breaks out above the descending trend line. However, this setup would be invalidated if the price action falls below the ABC pattern's lowest point.
It should also be stated that the 10-day MA (in orange) is positioned below the 20-day MA (in blue), which, in turn, is threading below the 30-day MA (in green). Moreover, the price action is concentrated below the three moving averages. All of this underscores the prevalence of the underlying selling pressure in the short run.

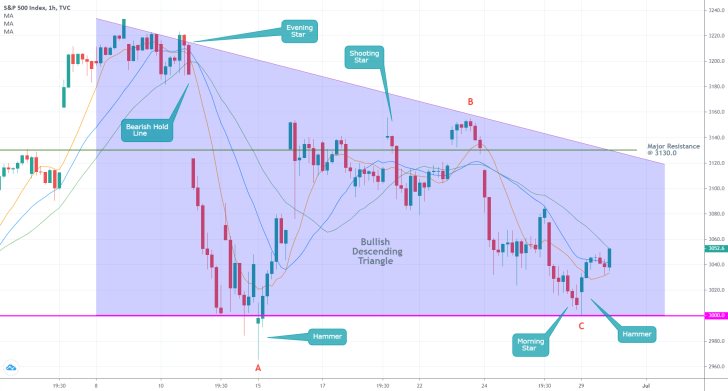
As can be seen on the hourly chart below, the price action is behaving 'logically' each time it nears either one of the triangle's two limits. It forms inherently bearish candlesticks when it is trading around the descending trend line, and inherently bullish candles when it is positioned close to the psychologically significant support level at 3000.0.
The formation of a morning star pattern, which is followed by a hammer, is suggestive of mounting bullish momentum in the very short-term, which, in turn, favours the establishment of a new markup.
These expectations are further supported by the fact that the price action is currently consolidating above the 10-day MA but below the 30-day MA. Should it manage to break out above the latter, the market bulls would have even more reasons to anticipate the formation of a new uptrend.

3. Concluding Remarks:
Many market experts have flaunted the argument that the stock market rally exceeds the current rate of economic recovery, which is demonstrative of price speculation. This, however, does not necessarily mean that the rally itself is not healthy. There is plenty of compelling evidence supporting the expectations for continued advances of the S&P 500 further north.
So, unless the underlying fundamentals change swiftly and unexpectedly, the price action of the index is likely to continue heading higher, once it breaks out above the aforementioned triangle's downwards sloping trend line. Even still, the market bulls should be cautious and watch especially carefully the manner in which the price of the index behaves around the psychologically important support level at 3000.0.

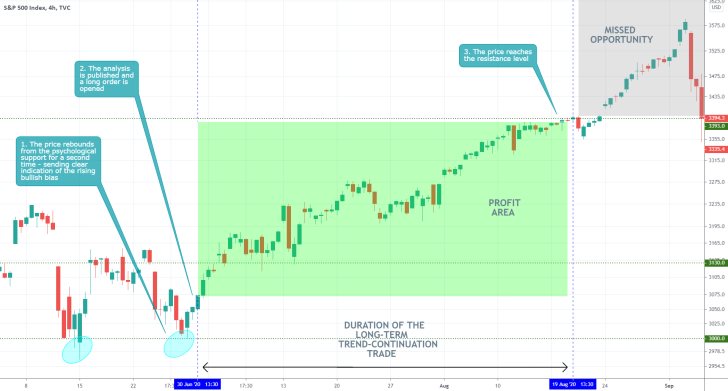
- The analysis was published at the perfect time for the implementation of a trend-continuation trade, which is why the trade accumulated such massive profits. The analysis was published shortly after the price had rebounded for a second time from the psychologically significant support at 3000.00, which represented a substantial indication of the forthcoming price appreciation. The trade was, however, terminated prematurely, missing out on even more profits. The analysis did an excellent job at examining the underlying fundamentals. When trading stock indices, which have a tendency to grow over time because of the intrinsic value of stocks, the best trades are executed when traders go long at the dip of such massive corrections.
Disclaimer: Your capital is at risk! Trading and investing on the financial markets carries a significant risk of loss. Each material, shown on this website, is provided for educational purposes only. A perfect, 100% accurate method of analysis does not exist. If you make a decision to trade or invest, based on the information from this website, you will be doing it at your own risk. Under no circumstances is Trendsharks responsible for any capital losses or damages you might suffer, while using the company’s products and services. For more information read our Terms & Conditions and Risk Disclaimer.


