Following a prolonged consolidation within the boundaries of a narrow range, the price action of the EURUSD is finally attempting a major breakout. If proved successful, this could entail the beginning of a new massive uptrend.
Both currencies are affected by soaring inflation, with consumer prices in the U.S. topping a four-decade peak and headline inflation in the Eurozone reaching an all-time high. However, the two did not react in similar ways. The greenback remains on the retreat following Fed Chair Jerome Powell's recent take on inflation, while the euro is attempting to recover against most other currencies.
This trend is likely to persist in the near term, given that this week's economic calendar seems mostly devoid of any major releases in the U.S., with the notable exception of the beginning of the latest earnings season.
Investors might be encouraged by potentially robust data posted by some of the biggest companies in the U.S., which could result in a temporary respite for the reeling stock market. Such a turn of events is likely to have a positive impact on the greenback in the short term.
Overall, the current market outlook seems suitable for the implementation of contrarian trading strategies by bulls striving to lock in long positions on the anticipation for the development of a new uptrend. In other words, they might try to buy into the latest upswing that is currently occurring just above the upper limit of the preceding consolidation range.
The Beginning of a New Wyckoff Cycle
The expectations of such a major breakout are underscored by the behaviour of the price action on the daily chart below. It depicts the possible emergence of a new Markup from the previous Accumulation range, as posited by the Wyckoff Method.
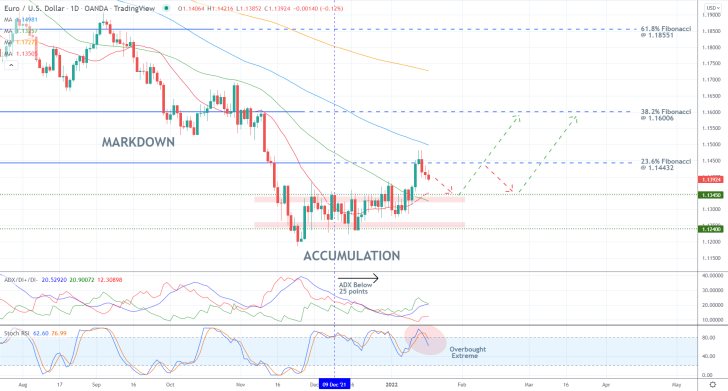
The Accumulation range spans between the major resistance level at 1.13450 and major support at 1.12400. Notably, the crossover between the 20-day MA (in red) and 50-day MA (in green) is currently converging with the upper limit of the range. This is what makes the recent breakout above it so significant.
The breakout was held back by the 23.6 per cent Fibonacci retracement level at 1.14432, which is what makes a pullback to the Accumulation range seem highly probable. Therefore, bulls might have the opportunity to trade on this classic set-up: buying the dip of the correction at the major resistance-turned-support at 1.13450.
Notice that the ADX has been threading below the 25-point mark since the 9th of December, signifying that the market technically continues to be range-trading. That is why the new uptrend would most likely fluctuate just above the range before the price action could begin to climb decisively.
This is what makes a potential pullback to the upper limit of the Accumulation so likely. The fact that the Stochastic RSI is currently in its overbought extreme further substantiates these expectations.
Concerning the longer term, the first target for the new uptrend would once again be the 23.6 per cent Fibonacci, while the next target would be the 38.2 per cent Fibonacci at 1.16006. Bulls should watch out for possible reversals from the 100-day MA (in blue).
Measuring the Current Pullback
As can be seen on the 4H chart below, the pullback commenced following a reversal from the upper limit of the ascending channel. A minor consolidation around the middle line of the channel was then followed by a breakdown to the support at 1.13850. The immediate behaviour of the price action around this support would be of crucial importance.
In addition to being a previous swing peak, this level is about to be crossed by the 50-day MA. Hence, this is the first threshold where the underlying pullback could potentially be terminated and the closest level where bulls could potentially look for an opportunity to go long.
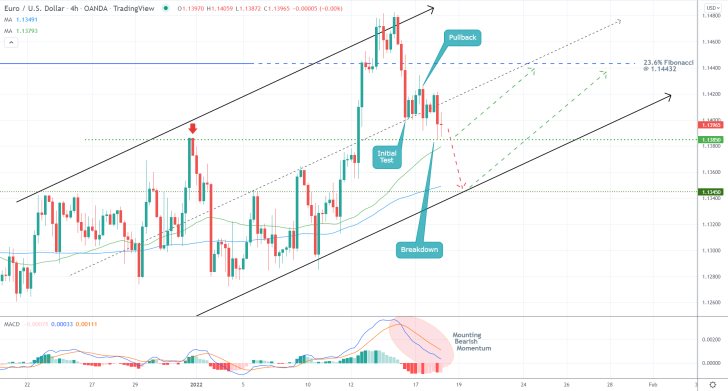
The other such level of interest is the aforementioned resistance-turned-support at 1.13450. It is currently converging with the 100-day MA and the lower limit of the channel, making it an even more prominent threshold.
Bulls should be careful not to join the market prematurely as the underlying momentum remains ostensibly bearish-oriented. This is highlighted by the MACD indicator and its declining histogram. Furthermore, the 12-day EMA remains below the 26-day EMA.
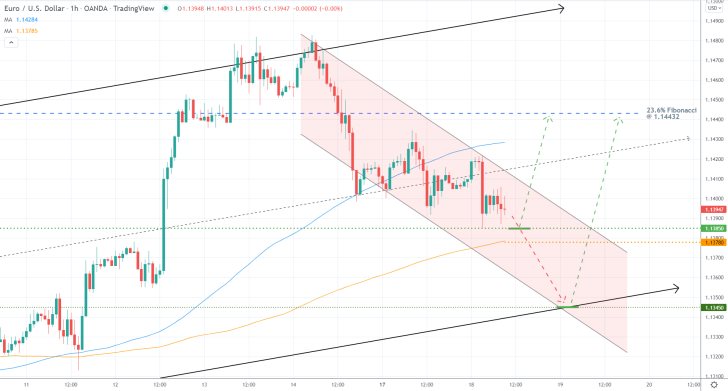
The pullback itself is represented as a Flag (in red) in the hourly chart below. Any decisive breakout away from its borders would signify the correction's termination.
While, in the near term, it is likely for the price action to continue zig-zagging towards 1.13450 within the Flag area, bulls should pay attention to the fact that the 200-day MA (in orange) is threading near the closer support at 1.13850. This increases the chances for a rebound sooner rather than later.
Concluding Remarks
Depending on their level of risk-aversion, bulls can trade this opportunity in one of two ways. They can either go long around the current spot price (1.13850), or they can place long limit orders at 1.13450. In the former case, they should place supporting stop-loss orders no deeper than ten pips below 1.13780. In the latter, their SLs should be positioned no deeper than 30 pips below 1.13450.
Once the price action breaks out above the 23.6 per cent Fibonacci retracement level at 1.14432, bulls would be able to either move their SLs to breakeven or substitute their stop orders for floating TPs altogether. As stated earlier, the next target for the new upswing will be the 38.2 per cent Fibonacci in the long term.
Will EURUSD Rebound from the Ascending Channel?
The price action of the EURUSD pair has been correcting following a false breakout above a major consolidation range. However, the dropdown is currently probing several major support levels, which could spell the correction's end. This, in turn, could allow bulls to implement trend continuation strategies on the expectations for another rebound.
Earlier today, Markit posted better-than-expected industrial numbers in Germany for January. The euro has not yet reacted to the news, but this solid performance of the biggest economy in the Eurozone is likely to help the single currency in the short term.
Meanwhile, the temporary dollar recovery is mostly owing to the robust earnings season in the U.S. However, volatility is likely to increase on the greenback in the following days in anticipation of the January policy meeting of the FED.
That is why trading on the underlying setup would entail a high degree of risk, and bulls need to implement very narrow stop-losses in order to protect their positions against probable adverse fluctuations.
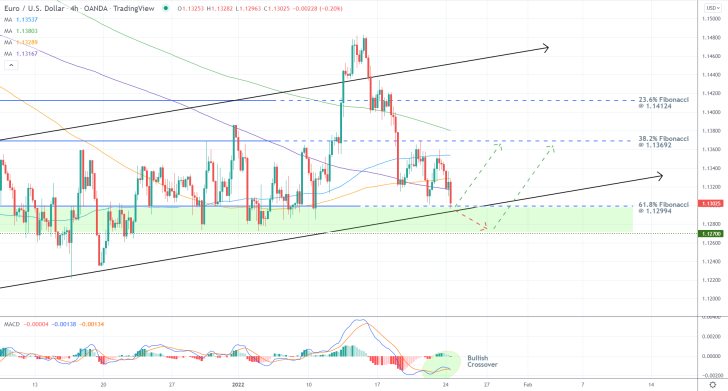
As can be seen on the 4H chart above, the dropdown is currently probing the lower limit of the ascending channel, which is converging with the 61.8 per cent Fibonacci retracement level at 1.12994. The latter is positioned very close to the psychologically significant threshold at 1.13000.
The expectations for a snap rebound are predicated on the fact that the MACD indicator has already recorded a bullish crossover in the underlying momentum. Additionally, the 300-day MA (in purple) and 200-day MA (in orange) represent two important floating supports, which bolster the likelihood of such a snap rebound.
That is why bulls might consider placing long market orders at the current spot price (around the 61.8 per cent Fibonacci). Their supporting stop-loss orders should be positioned just below the previous swing low at 1.12700.
The major target for such a bullish rebound would be the 23.6 per cent Fibonacci at 1.14124. Once the price action penetrates above the 38.2 per cent Fibonacci at 1.13692, bulls could implement floating TPs in order to protect themselves against future adverse fluctuations.
The Scramble for Safe Havens Jolts the EURUSD
The U.S. dollar gained significant bullish momentum over the last several days owing to several contributing factors. Chiefly, the escalating tensions between Russia and Ukraine, which could potentially lead to war, have made investors scramble for safe havens. This has significantly increased the demand for the dollar as the world's most easily convertible currency.
Additionally, the highly-anticipated Fed policy meeting for January further curbed investors' demand for higher-risk assets. As was expected, the FOMC adopted a much more pronounced hawkish stance, which underpins the possibility of a rate hike as early as March.
Bulls and bears can benefit from the resulting upsurge in selling pressure on the EURUSD in two different ways. The former might try to utilise the much riskier contrarian trading strategies, trying to catch the next pullback. The latter, in contrast, could implement trend-continuation trading strategies at the peak of the next pullback.
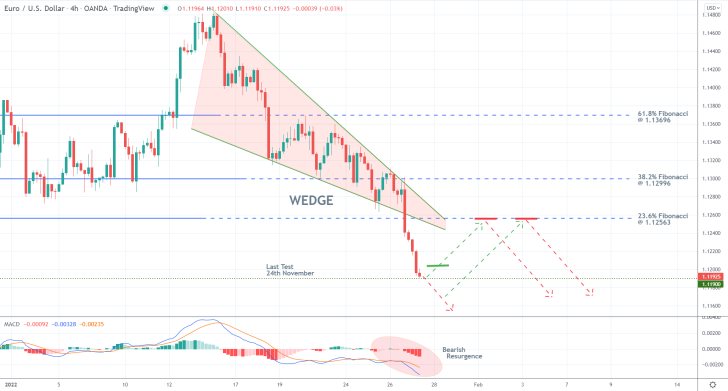
As can be seen on the 4H chart above, yesterday's FOMC meeting catalysed a decisive breakdown below the Wedge pattern, signifying the likely beginning of a new downtrend. However, the price action is currently probing the psychologically significant swing low at 1.11900, which was last tested on the 24th of November. Being the last major support level, this is where a pullback is most likely to emerge.
Such a pullback could reach as high as the 23.6 per cent Fibonacci retracement level at 1.12563, though bulls should be mindful of the decidedly bearish momentum, as illustrated by the MACD indicator, that continues to prevail.
Bulls might consider entering long at around 1.12000 if the price action rebounds from the swing low, however, their supporting stop-loss orders should be placed no more than 20 pips below their initial entries. Even still, they should keep in mind that such contrarian trading would involve a very high degree of risk, which is why the opportunity is not suitable for risk-averse bulls.
Their target would be the 23.6 per cent Fibonacci at 1.12563, which is where bears, in turn, could place short limit orders on the expectations for a reversal. Their stop-loss orders should not exceed 30 pips. Bears' first target would be the swing low at 1.11900. Once the price action reaches there, bears could substitute their fixed stop orders for floating TPs. That way, they would be able to catch a potentially deeper dropdown further down south.
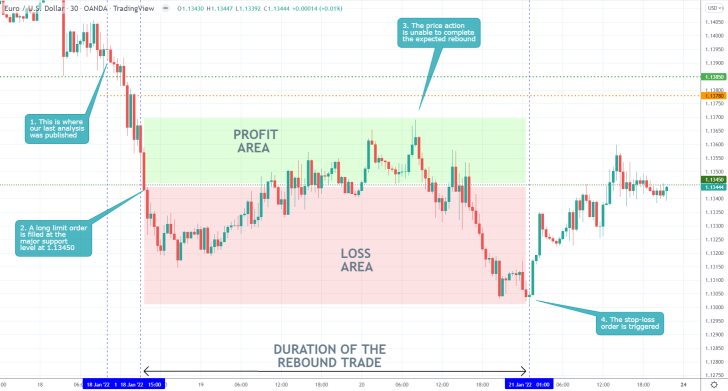
- The expectations of our last EURUSD analysis for a bullish rebound from the major support level at 1.13450 were not realised. Following the recent dropdown to said level, a long limit order was filled there.
- The price action went on to consolidate around this threshold without making any significant headway in either direction for some time afterwards.
- Then, one of the adverse fluctuations triggered the supporting stop-loss order that was positioned 30 pips below the initial entry-level.
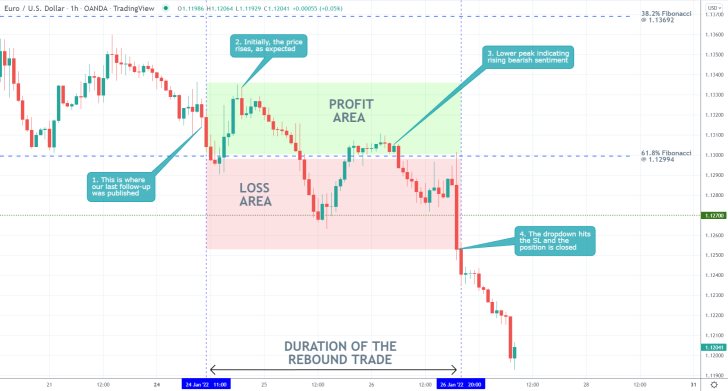
- The expectations of our last EURUSD follow-up were not realised. Shortly after its publication, the price action consolidated around the 61.8 per cent Fibonacci retracement level at 1.12994, but then the decisive breakdown below the 1.12700 support triggered the stop loss.
- The biggest drawback of the follow-up was that it underappreciated the upsurge in demand for the greenback, as a safe currency, amidst the escalating tensions between Russia and Ukraine.
- In such cases, it is best for a trader to re-evaluate the situation before returning to the market. It is vitally important not to try to 'beat' the market at times of heightened adverse volatility.
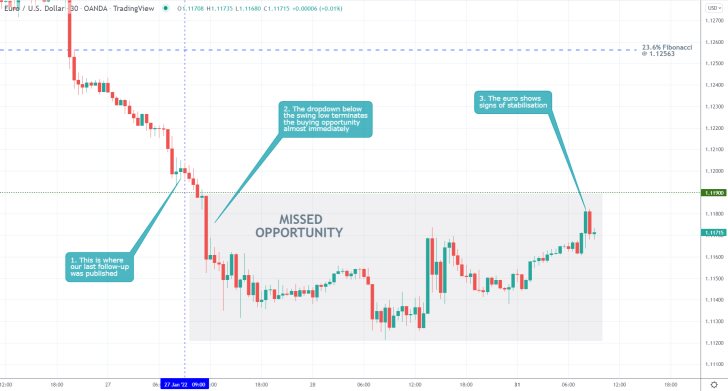
- Our last EURUSD follow-up did not generate any profits because the price action did not rebound from the previous swing low at 1.11900. However, it did not incur any losses either.
- Its strongest aspect was its caution not to sell around the dip of the downtrend, which would have borne the risk of adverse fluctuations. As can be seen, the price action did indeed go on to consolidate around 1.11900 subsequently.
- Traders should always be mindful not to join an existing trend too late into its development.
Disclaimer: Your capital is at risk! Trading and investing on the financial markets carries a significant risk of loss. Each material, shown on this website, is provided for educational purposes only. A perfect, 100% accurate method of analysis does not exist. If you make a decision to trade or invest, based on the information from this website, you will be doing it at your own risk. Under no circumstances is Trendsharks responsible for any capital losses or damages you might suffer, while using the company’s products and services. For more information read our Terms & Conditions and Risk Disclaimer.


