The most popular cryptocurrency in the world has been massively undervalued since late 2021 owing to a number of contributing factors. But upon closer examination, the price action appears to be establishing a massive Head and Shoulders pattern which, if realised, would entail the development of an even bigger downtrend in the long run. Nevertheless, this may also entail bulls with an opportunity to go long over the coming weeks and possibly months.
Bitcoin and the crypto market as a whole are becoming increasingly more dependent on the current state of the U.S. dollar as the global recovery progresses. This means that Bitcoin was impacted just as much by the recently observed inflation spike in the U.S. as the greenback, which explains their mutual woes as of late.
However, this temporary condition may change, given the expectations for another robust earnings season. Morgan Stanley's quarterly results from yesterday proved that there is a chance for investors' outlook to improve in the near term, which would likely drive the dollar higher. Accordingly, higher-risk assets like Bitcoin are also likely to benefit from this.
Consequently, the current setup entails different opportunities for bulls and bears. The former might be able to implement contrarian trading strategies in the short term, while the latter might use trend continuation strategies in the longer term.
Sizing Up the Currently Emerging Head and Shoulders Pattern
As can be seen on the daily chart below, there seems to be a confluence of indicators all pointing to the development of such a massive pattern, which typically is taken to signify probable bearish reversals.
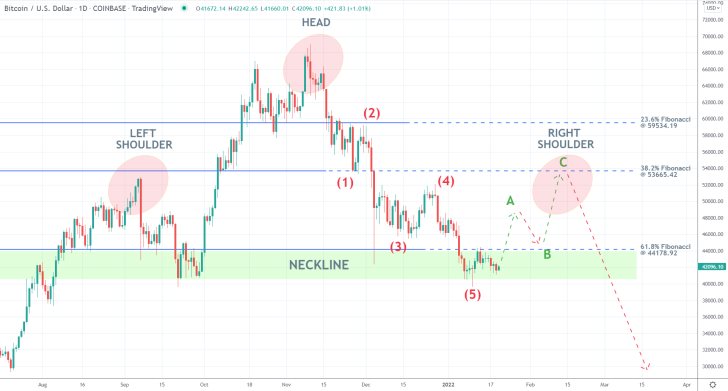
The price action is consolidating around the lower limit of a significant Support Area (in green), underpinned by the previous swing low. Its upper end, in turn, is signified by the 61.8 per cent Fibonacci retracement level at 44178.92. Those two seem to outline the Neckline area of the H&S pattern. This makes the possibility of a bullish rebound in the near term seem probable.
Such a rebound is likely to result in a pullback towards the 38.2 per cent Fibonacci at 53665.42, which seems to outline the two shoulders of the broader H&S pattern roughly. From there, the new massive downtrend is likely to emerge, with the long-term target being the last dip at around the psychologically significant support level at 30000.00.
Last but not least, the recent dropdown from the Head to the Neckline appears to be taking the form of a 1-5 impulse wave pattern, as postulated by the Elliott Wave Theory. Given that this Elliott cycle is seemingly over, a bullish ABC correction seems the most probable continuation. Bulls trading on the expectations for such a bullish correction need to be careful of potential adverse fluctuations around the 61.8 per cent Fibonacci.
The Wedge at the Dip of the Last Dropdown
The apparent development of a Wedge further substantiates the expectations of a bullish pullback emerging from the current dip, as shown on the 4H chart below.
The Wedge started developing after the last impulse leg (4-5) of the Elliott pattern was completed in the form of a Hammer candlestick; this is a type of candle that typically entail possible bullish reversals.
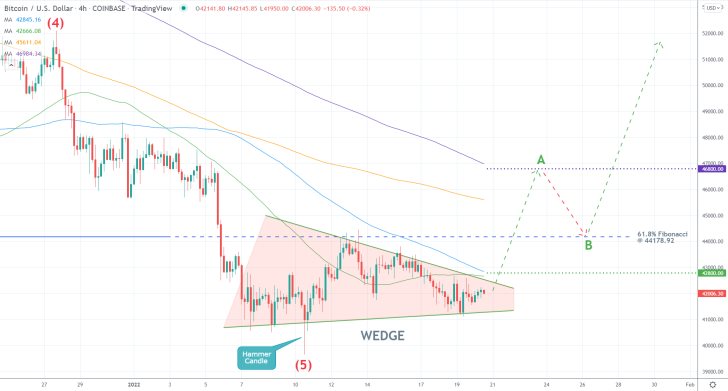
Notice that the 50-day MA (in green) and 100-day MA (in blue) are presently converging just above the upper limit of the Wedge at around 42800.00. It is for that reason that a decisive breakout above the Wedge and this resistance level would confirm the commencement of a bullish correction (likely in the shape of an ABC pattern).
Once the price action penetrates above the 61.8 per cent Fibonacci, bulls should keep an eye for potential reversals from the 200-day MA (in orange). Meanwhile, the 300-day MA (in purple) is currently converging with the aforementioned resistance level at 46800.00, making the latter an even more prominent turning point.
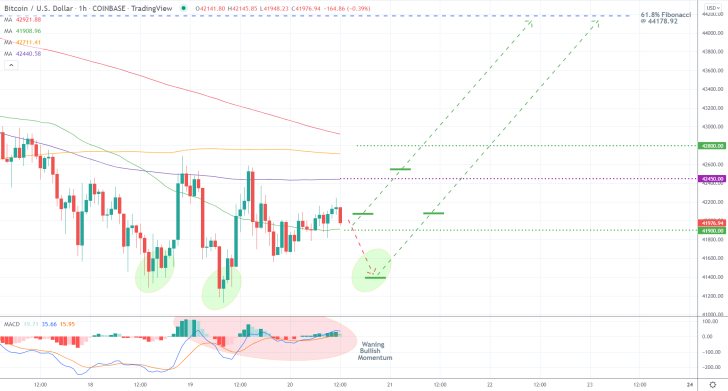
A peculiar thing seems to be happening on the hourly chart below. A sort of an inverted Head and Shoulders has been developing over the last couple of days, confirming the expectations for a bullish correction. Nevertheless, the underlying bullish momentum has been steadily falling, as demonstrated by the decreasing histogram of the MACD indicator.
The 50-day MA underscores a critically important resistance-turned-support at 41900.00, while the 200-day MA and 400-day MA (in red) are bolstering the resistance at 42800.00. Bulls should also watch the intermediate resistance at 42450.00, underpinned by the 300-day MA.
Concluding Remarks
More risk-averse bulls could place long limit orders around 41400.00 on the expectations for the completion of the inverted head and shoulders in the short term. Less risk-averse bulls, in contrast, could enter long around the current spot price, though they should consider the great risk of adverse fluctuations in the next several hours.
In the first case, their supporting stop-loss orders should not be placed more than $300 below their initial entry levels. In the second case, their SLs should be placed no more than $200 below 41900.00.
Another possibility would be for bulls to execute long market orders once the price action breaks above 42450.00. At any rate, bulls could substitute their fixed stop orders for floating TPs once the price action penetrates above 42800.00. Their first major target would be the 61.8 per cent Fibonacci at 44178.92.
Bitcoin to Fluctuate Around the Closest Fibonacci Threshold
The crypto market is in general turmoil as traders and investors' interest in high-risk assets plummets. This caused the price of Bitcoin to briefly tumble to 33000.00 recently, though a bullish pullback emerged afterwards.
This pullback is unlikely to spell the beginning of a definite bullish rebound, which implies the possibility of implementing trend-continuation trading strategies by bears. Bulls, in contrast, could potentially implement the much riskier contrarian trading strategies in the shorter term.
The strong selling pressure is the result of a mixture of geopolitical and economic factors. Market participants are eagerly waiting to see whether the FOMC adopts a much more hawkish policy stance later today while rising tensions alongside Ukraine's border with Russia keep the demand for the dollar high. It is because investors are actively looking for lower-risk securities that leads to the general decline in demand for Bitcoin.
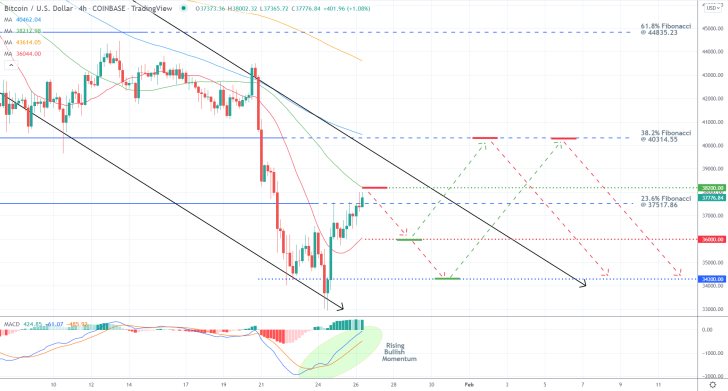
As can be seen on the 4H chart above, the current pullback commenced following a rebound from the lower limit of the broader descending channel. This led to a sharp uptick in bullish momentum in the short term, underscored by the MACD indicator.
Presently, the price action is probing the 23.6 per cent Fibonacci retracement level at 37517.86, which is where the pullback is likely to be checked. This likelihood is further bolstered by the fact that the major resistance at 38200.00, underpinned by the 50-day MA (in green), is positioned just above the current peak of the pullback.
Hence, bears could look for an opportunity to sell around the current spot price, placing narrow stop-losses no more than $200 above the resistance at 38200.00. Their ultimate target would be the previous swing low at 34300.00, though they should be ready for a potential rebound from the major support at 36000.00. The latter is underlined by the 20-day MA (in red). That is why they could implement floating TPs or move their stop orders to breakeven once the price action has moved sufficiently in their favour.
Bulls, in contrast, could place long limit orders at 34300.00 or execute long market orders if the price rebounds from 36000.00. In either case, their supporting stop-losses should not exceed $200 either. Their target would be the 38.2 per cent Fibonacci at 40314.55, where they could collect their profits, while bears could place new selling orders.
At any rate, bulls should move their stop orders to breakeven once the price action moves past the 23.6 per cent Fibonacci.
Bitcoin's Ascending Wedge is Almost Completed
Bitcoin's bullish pullback looks almost completed, which implies the likely continuation of the broader downtrend afterwards. The pullback itself took the form of an Ascending Wedge, which is a type of pattern that signifies probable trend continuation.
That is why the underlying setup entails the possibility for the implementation of trend-continuation strategies by bears looking to sell the peak of the bullish pullback.
Particularly high-risk assets are likely to be hit by an upsurge in selling pressure this week as demand for lower-risk securities is expected to rise. The pace of the global economic recovery continues to be bumpy and uneven, whereas the robust earnings season in the U.S. would probably focus investors' attention on stocks. Both factors are likely to drive the attention away from Bitcoin, thereby increasing the underlying selling pressure.
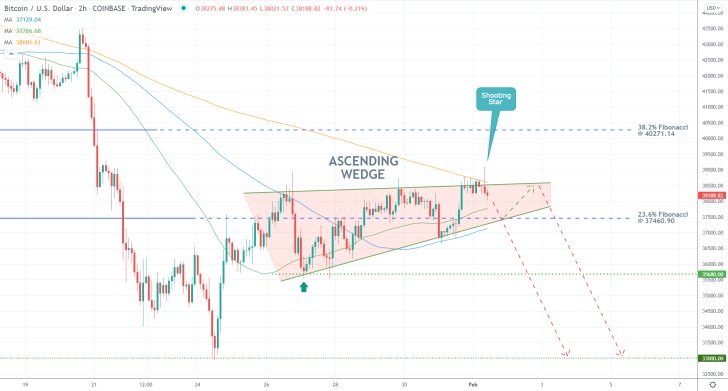
The bottleneck of the aforementioned Wedge looks set for completion just above the 23.6 per cent Fibonacci retracement level at 37460.90, as shown on the 2H chart above.
On the one hand, the emergence of a Shooting Star candle at the 200-day MA (in orange), which is currently converging with the upper limit of the Wedge, represents a major bearish indication of a very probable bearish reversal currently in the making.
On the other hand, the 23.6 per cent Fibonacci, 50-day MA (in green), and 100-day MA (in blue) are all currently converging with the lower limit of the Wedge. This could prompt one final rebound to the Wedge's upper limit before the broader downtrend could be resumed.
Bears could sell around the current spot price, though their supporting stop-loss orders should not be placed higher than 38700.00 (current position of the 200-day MA). Their ultimate goal would be the previous swing low at 33000.00, though minor bullish pullbacks from 35680.00 (dip of the Wedge) are also possible. That is why once the price action breaks down below the 23.6 per cent Fibonacci decisively, bears should consider moving their SLs to breakeven.
As stated above, the price action may re-test the upper limit of the Wedge once more, which is why bears may have to execute several orders around it before they catch the eventual dropdown. However, the selling opportunity would be terminated if the price action breaks out above 39000.00 decisively.
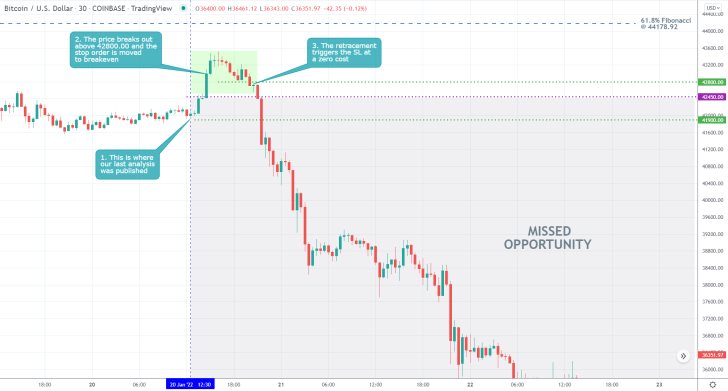
- The expectations of our last Bitcoin analysis were not realised. Though a minor bullish rebound from the 41900.00 support did occur, it did not reach the 61.8 per cent Fibonacci retracement level at 44178.92.
- However, the price action did penetrate above 42800.00 temporarily, which allowed for the stop order to be moved to breakeven. This prevented incurring any losses on the subsequent reversal.
- What the analysis lacked the most was a solid apprehension of just how strong the underlying selling pressure currently is.
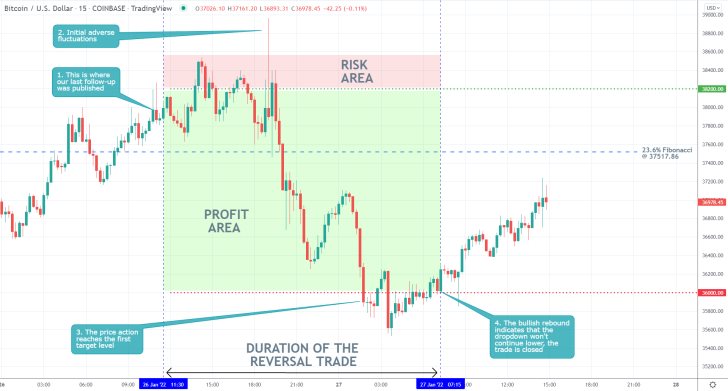
- The expectations of our last Bitcoin follow-up for a dropdown to the major support level at 36000.00 were realised. However, the initial adverse fluctuations above 38200.00 curbed the performance of the trade.
- Bitcoin remains especially volatile, which is why it is not suitable for risk-averse traders.
- The above is a good example of why sometimes, traders may need several attempts before they gain a favourable entry. However, this entails higher psychological strain and demands a strong mentality.
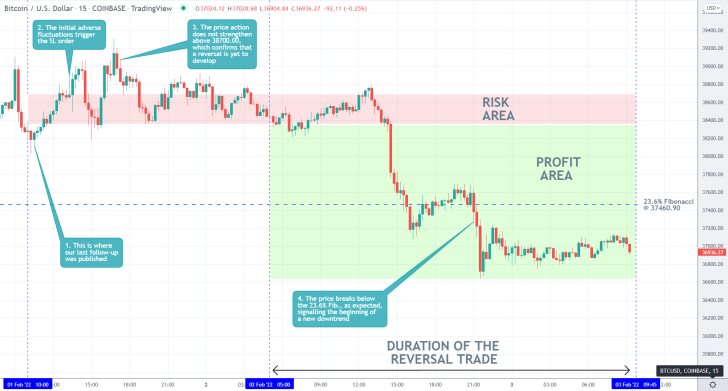
- Despite some initial tribulations, the expectations of our last Bitcoin follow-up for a bearish reversal were realised.
- Following a temporary consolidation of the price action above the upper limit of the Wedge (see the follow-up), the price action reversed from it and penetrated below the 23.6 per cent Fibonacci retracement level at 37460.90.
- The price action is likely to continue falling in the near future.
Disclaimer: Your capital is at risk! Trading and investing on the financial markets carries a significant risk of loss. Each material, shown on this website, is provided for educational purposes only. A perfect, 100% accurate method of analysis does not exist. If you make a decision to trade or invest, based on the information from this website, you will be doing it at your own risk. Under no circumstances is Trendsharks responsible for any capital losses or damages you might suffer, while using the company’s products and services. For more information read our Terms & Conditions and Risk Disclaimer.


