The price of the cryptocurrency temporarily fell below the psychologically significant 30000.0 mark this week before returning back above this major threshold. Part of the reason why the crypto advanced had to do with Elon Musk's recent comments concerning Tesla and SpaceX, saying that both companies use Bitcoin.
Musk also stated that Tesla would likely increase its holdings of Bitcoin, provided that the method for crypto mining becomes greener. This represented a much-needed adrenaline shot for the reeling Bitcoin. However, it seems unlikely that a new uptrend can be initiated solely on the strength of this momentary uptick in enthusiasm.
Still, the underlying price action continues to consolidate around the 61.8 per cent Fibonacci retracement level from the previous rally, representing a major make-it-or-break-it point. This is owing to the fact that this is the last Fibonacci barrier before the price breaks decidedly down south.
That is why the price action is likely to continue consolidating around the current spot price in the near future, thus creating range-trading opportunities in the short term. Meanwhile, the current earnings season is just picking up speed and would likely bolster volatility in the market for higher-risk assets. This is also likely to have a spillover effect on the price of Bitcoin, prompting more fluctuations around the 61.8 per cent Fibonacci.
Consolidating in a Wedge Around the 61.8 per cent Fibonacci
The daily price chart below underscores the ongoing consolidation around the 61.8 per cent Fibonacci retracement level at 30959.8. It takes the form of a Descending Wedge, which typically indicates potential bullish reversals when found at the bottom of a downtrend.
Several candles have already probed this major support in the last, leaving big lower shadows in their wake. The day before yesterday was the first instance when the price action was able to close below 30959.8. Therefore, even though the emergence of a massive Wedge pattern signifies a potential bullish rebound currently in the making, traders should keep in mind that considerable bearish pressure in the short term persists.
Additionally, the 50-day MA (in green), which currently serves as a floating resistance, threads around the upper boundary of the Wedge. This would make a decisive breakout above the pattern even more difficult.
Meanwhile, the 100-day MA (in blue) has only recently crossed below the 38.2 per cent Fibonacci retracement level at 43983.0, which represents the next major bullish target.
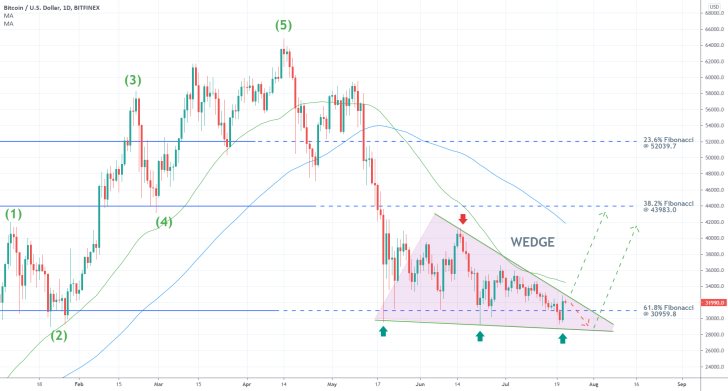
The lower boundary of the Wedge has been tested on three separate occasions, while its upper limit has been probed only once. This means that there is a very high probability that the price action would not be able to break the upper limit of the pattern on its second attempt.
In other words, the price action would likely test the 61.8 per cent Fibonacci one more time, even threading momentarily below it, before it is able to make any significant gains up north.
The Upcoming Reversal from the Channel
When examined on a lesser timescale, the most recent price action appears concentrated within the boundaries of a descending channel. This can be seen on the 4H chart below. The upper boundary of the channel coincides with the upper limit of the Wedge.
Seeing as how a Shooting Star candle emerged just below the channel's upper boundary, another reversal seems very likely. Yet, the Shooting Star was held back by the 50-day MA, which means that there is strong support around 31500.00. In contrast, the 150-day MA (in orange) threads just above the channel, making it a prominent floating resistance.
Both bulls and bears should watch the behaviour of the price action between these two moving averages carefully, as this minor consolidation could create a bottleneck.
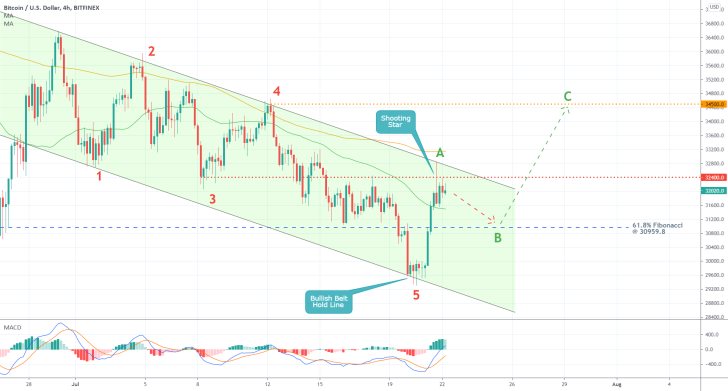
Despite that the MACD indicator is underpinning recuperating bullish momentum, the price action is so far being unable to break the minor resistance level at 32400.0. The latter was initiated from the swing low at point 3. Its prominence is further bolstered by the fact that it is currently converging with the upper limit of the channel. Hence, bears should look for a potential reversal from the 32400.0 mark.
Notice also that the channel outlines a 1-5 impulse wave pattern, as postulated by the Elliott Wave Theory. It was completed just below the 61.8 per cent Fibonacci before the present ABC correction (bullish) started taking shape.
The anticipated reversal is likely to represent the AB retracement leg, probably sinking to the 61.8 per cent Fibonacci before the price goes on to develop the BC impulse leg. AB was initiated from the bottom of the previous 2-3 impulse leg, while BC is likely to climb towards the peak of the 3-4 retracement leg, at 34500.0.
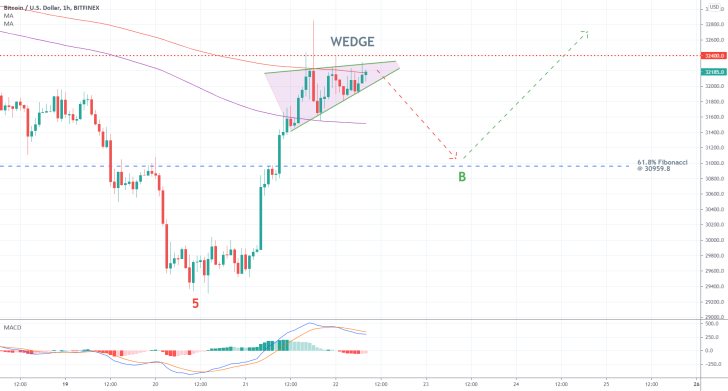
The reversal itself is likely to occur from the eventual breakdown below the minor Wedge, as seen on the hourly chart below. It is likely to happen as the bullish upswing gets denied below the 300-day MA (in red). Meanwhile, a breakdown below the 200-day MA (in purple) would confirm the existence of strong bearish pressure.
This is already starting to increase, as underscored by the minor bearish crossover on the MACD indicator.
Concluding Remarks:
Bears could look for a chance to utilise contrarian trading strategies in the near term. They can trade on the expectations for a dropdown to the 61.8 per cent Fibonacci while placing a stop-loss order just above the 32400.0 resistance.
Bulls, in contrast, could place long limit orders at the 61.8 per cent Fibonacci, with a SL just below it. They would be aiming for a pullback to 34500.0. If the price manages to break out above it, they could substitute their fixed stop orders for floating TPs in order to squeeze the maximum out of a potential upswing above 34500.0.
Bitcoin Due for a Correction
What goes up must come down. Typically, traders should avoid placing positions on tired clichés; however, this does not concern the 7-day correction strategy. In the current case of Bitcoin, the cryptocurrency's price action has been advancing for eight consecutive days, which raises the possibility of a correction exponentially with each passing day.
This means that after the seventh day of consecutive gains, the likelihood of a dropdown becomes increasingly more significant with each new day of additional gains. The rally was largely inspired by the robust earnings season in the U.S., as traders and investors turn to higher risk assets.
But now that most of the big blue-chip companies have already posted their earnings, with the exception of Amazon, the market will be ready to price in the quarterly numbers. This would increase the likelihood of a correction on the price of Bitcoin in the near term.
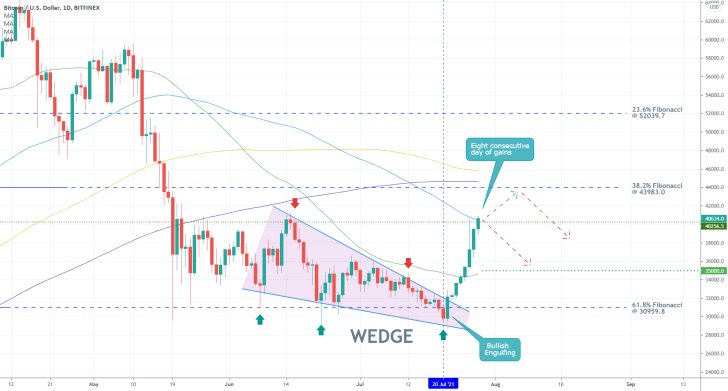
The latest upswing commenced after an expected breakout above the Descending Wedge pattern, as can be seen on the daily chart above. It took the form of a Bullish Engulfing candle from the 61.8 per cent Fibonacci retracement level at 30959.8.
The price action reached the psychologically significant resistance level at 40000.00, which is a major make-it-or-break-it threshold. This makes the latter a very likely turning point, which is congruent with the expectations for an imminent correction.
Additionally, the 40000.00 benchmark is currently being crossed by the 100-day MA (in blue), which serves the role of a prominent floating resistance. A likely reversal from it could then be followed by a bearish correction to the 50-day MA (in green) at 35000.00.
However, if the price action manages to break out above 40000.00 and the 100-day MA, then the upswing could be extended towards the 38.2 per cent Fibonacci retracement level at 43983.0. The significance of the latter is bolstered by the fact that the 150-day MA (in orange) and the 200-day MA (in purple) are both threading near it.
Bears could look for a chance to sell near the current market price; however, they should place very tight stop-loss orders.
Bitcoin's Correction Bound to Speed Up
As was anticipated by our last analysis of Bitcoin, the cryptocurrency's price started developing a new downtrend. Bearish pressure keeps mounting as the general liquidity levels in the market continue to drop. This can be observed in other less volatile markets, where assets consolidate within a range.
This is mainly owing to diminished trading activity because of the impact of market seasonality. Additionally, markets have already started to come to terms with the fact that short term inflation is massively exceeding the 2.0 per cent mark, which is decreasing the levels of adverse uncertainty.
Following a decisive reversal from the psychologically significant resistance level at 40000.0, the price of Bitcoin looks poised to continue depreciating in the near future. This entails bears with the opportunity to utilise trend continuation trading strategies.
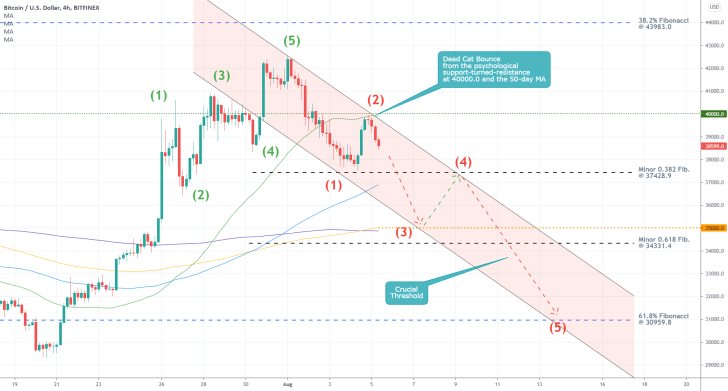
As can be seen on the 4H chart above, the current downtrend emerged following the completion of the previous uptrend. The latter is underpinned by a bullish 1-5 impulse wave pattern (in green), as postulated by the Elliott Wave Theory. Given the fractal nature of the market, the current downtrend is also likely to take the form of a bearish 1-5 impulse wave pattern (in red).
The first impulse leg (0-1) bottomed out at the minor 0.382 Fibonacci retracement level (as measured against the previous upswing) at 37428.9. The first retracement leg (1-2) then peaked at the psychologically significant support-turned-resistance level at 40000.0.
At that time, the 50-day MA (in green) was converging with this crucial threshold, making the subsequent reversal even more prominent. In its wake, the price action established a Dead Bounce Cat, which is a type of pattern that confirms the underlying bearish expectations.
Next, if the price action manages to penetrate below the 0.382 Fibonacci, which is about to be crossed by the 100-day MA (in blue), the next target for the second impulse leg (2-3) would be somewhere around the lower boundary of the descending channel.
This is most likely to occur around the semi-psychological support at 35000.00. The significance of this major support level is underpinned by the fact that the 200-day MA (in orange) and the 300-day MA (in purple) are both currently converging around it. The second retracement leg (3-4) is then likely to emerge, potentially reaching the 37428.9 mark from below.
Bears looking to sell around the current spot price should place very narrow stop-loss orders, no more than several hundred dollars away from their initial entry. Their first target is the major support at 35000.00.
Additionally, they could add to their selling orders/open new positions once the price action pulls back to the 0.382 Fibonacci from below, effectively selling at the peak of the next correction.
The deeper target for the dropdown is underpinned by the 61.8 per cent Fibonacci retracement level (as measured against the broader trend) at 30959.8.
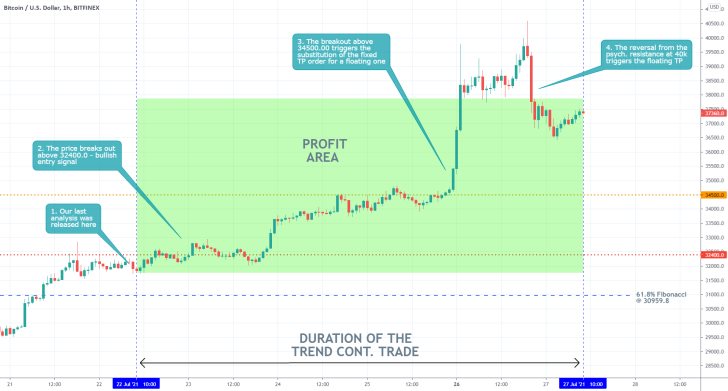
- Undoubtedly, this was one of our most successful analyses yet. Even though a minor loss might have been incurred by bears who sold below 32400.00, the eventual breakout above this level signalled the bullish commitment in the market.
- The cause of the upsurge was Elon Musk's recent comments stating that Tesla would continue using Bitcoin if the cryptocurrency were to become greener.
- The decision to use floating take-profit orders above 34500.00 was the right one, as it allowed bulls to catch the most out of the subsequent price appreciation.
- After closing such a successful position, traders should maintain their composure and not allow their wins to get to them. Too much pride could be detrimental to a trader's consistency.
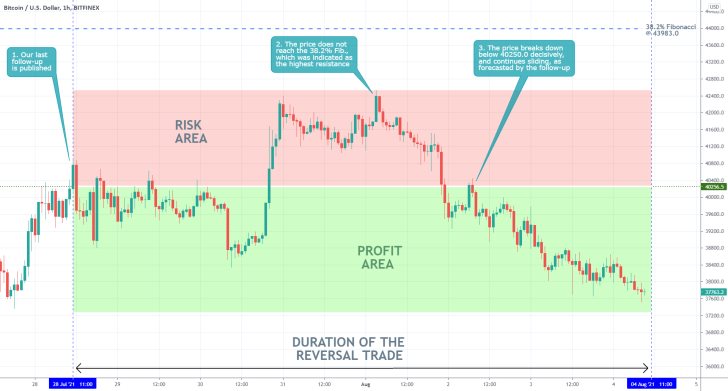
- Our last follow-up analysis of Bitcoin forecasted a bearish reversal successfully. However, there are several important notes that have to be made with regard to the development of the trade.
- In the analysis, it was argued that before a reversal from 40250.0 could occur, the pullback could be extended to the 38.2 per cent Fibonacci retracement level at 43983.0.
- The price did not go as high, but even still, the pullback was extended by more than $2000 above the 40250 resistance. This is enough to have hit any stop-losses of contrarian trades placed just below 40250.
- It would have been a mistake to move the SL higher in anticipation of an eventual reversal. Traders certain in their forecasts would have let the price action hit the SL of their initial orders before placing a second position on the same expectations.
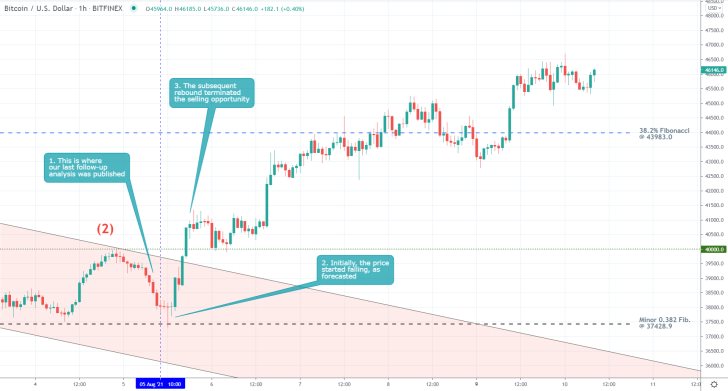
- Our last follow-up analysis of Bitcoin incurred a loss, despite some initial moderate success. Shortly after its release, the price action fell to the minor 0.328 Fibonacci retracement level at 37428.9 before rebounding.
- The subsequent breakout above the descending channel's upper boundary terminated the selling opportunity.
- Despite incurring a loss, the trade was ultimately warranted because there was a pretty strong case to be made at the time that the price action was to continue sliding within the channel.
- Ultimately, that is why it is so vitally important to utilise narrow stop-losses in order to hedge against such sudden and unforeseeable changes in the direction of the price action.
Disclaimer: Your capital is at risk! Trading and investing on the financial markets carries a significant risk of loss. Each material, shown on this website, is provided for educational purposes only. A perfect, 100% accurate method of analysis does not exist. If you make a decision to trade or invest, based on the information from this website, you will be doing it at your own risk. Under no circumstances is Trendsharks responsible for any capital losses or damages you might suffer, while using the company’s products and services. For more information read our Terms & Conditions and Risk Disclaimer.


