The underlying supply and demand equilibrium in the energy market is currently changing. Demand is falling as the global economic recovery is presently undergoing through a soft patch owing to a number of contributing factors. This is prompting the beginning of a new bearish correction on the price of crude oil.
The most significant factors currently weighing down on the commodity include the tumultuous vaccination efforts in Europe; the uneven pace of global recovery (here and here); the expectations for continued troubles for the key industrial sectors in Europe; and the momentarily subdued consumption in the U.S. All of these factors, in conjunction with the relatively uneventful week ahead, are likely to support such a bearish reversal on the price of crude oil.
Trading on such expectations for a reversal from an established trend entails a high degree of risk because transitions from one sentiment into another are typically characterised by heightened volatility. That is why it is of pivotal importance to spot the boundaries of the last upswing, which will allow for more precise trade execution.
1. Long-Term Outlook:
As can be seen on the daily chart below, the Shooting Star candle signifies the peak of the last upswing. Meanwhile, the psychologically significant support level at 60.00 marks its lower boundary. Shooting stars typically entail rising bearish pressure and the termination of a recent uptrend, which is inlined with the primary expectations for another reversal.
The Ichimoku Cloud indicator is used in order to underpin the pressure points of the existing uptrend. The recent breakdown penetrated below the conversion line (in blue) and the base line (in dark red), which represents the first major confirmation of mounting bearish pressure. The bearish pressure will continue to increase for as long as the price action remains concentrated below those two lines. In other words, the currently emerging pullback could reach as far as 63.20 before the bearish momentum is resumed. Bears can utilise this pullback to gain a better entry by selling at its peak in anticipation of further dropdowns.
The ADX indicator has been threading above the 25-point benchmark since the 2nd of December, which underscores the recent uptrend's strength. Even though the underlying market sentiment continues to be trending, the recent bearish crossover of the DI- (in red) shooting above the DI+ (in green) represents an early signal of a likely new downtrend.
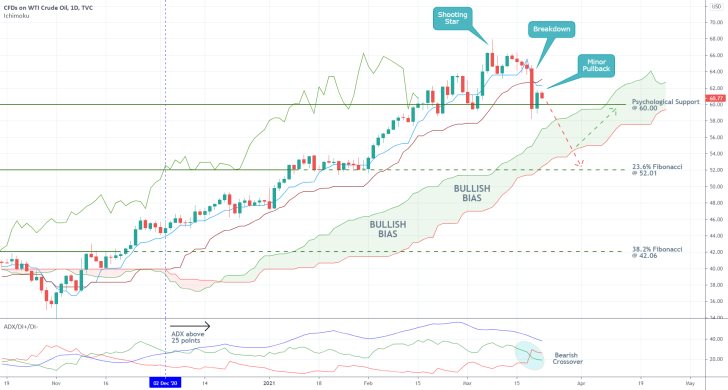
If the price action manages to break down below the psychologically significant support level at 60.00, then the next most likely target for the new downtrend will be the 23.6 per cent Fibonacci retracement level at 52.01. However, bears should keep an eye on the Ichimoku Cloud underpinning the bullish bias. The cloud itself serves as a floating support area, and bullish rebounds are likely to emerge from within the cloud.
2. Short-Term Outlook:
The 4H chart below underlines the exact manner in which the existing uptrend is transitioning into a new downtrend. As shown, a Descending Triangle pattern was developed at the recent swing high, demonstrating the precise moment of transition.
The lower boundary of the triangle is encompassed by the major resistance (previously support) level at 63.50, which continues to serve an important role. It signifies the highest possible point to which a bullish pullback can reach before the selling opportunity gets terminated.
As stated earlier, the psychological support level at 60.00 marks the most important make-it-or-break-it barrier for the bearish correction. It will take only a decisive breakdown below it to confirm these bearish expectations. That is why the Support Area (in green) is drawn, based on the previous interactions of the price action with the 60.00 level, to illustrate what exactly would constitute a 'decisive breakdown'. That is so because while the price action probes the Support Area, there would still be a considerable likelihood for another bullish rebound.
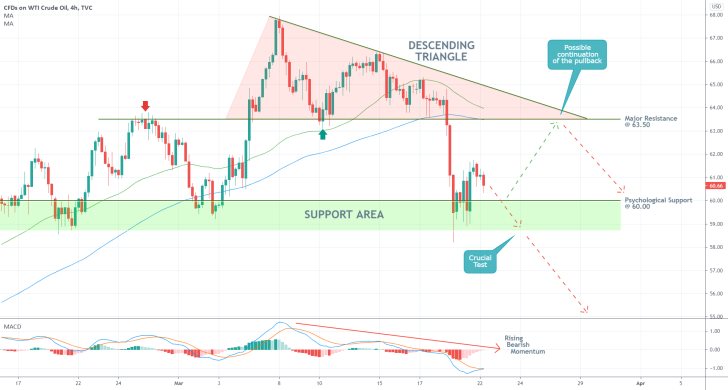
The price of crude needs to close below the Support Area's lower boundary (at around 58.90) to substantiate these bearish expectations. Those are also underpinned by the MACD indicator, which demonstrates the presently rising bearish momentum. Moreover, the underlying bearish pressure would remain active for as long as the price action remains concentrated below the 50-day MA (in green) and the 100-day MA (in blue).
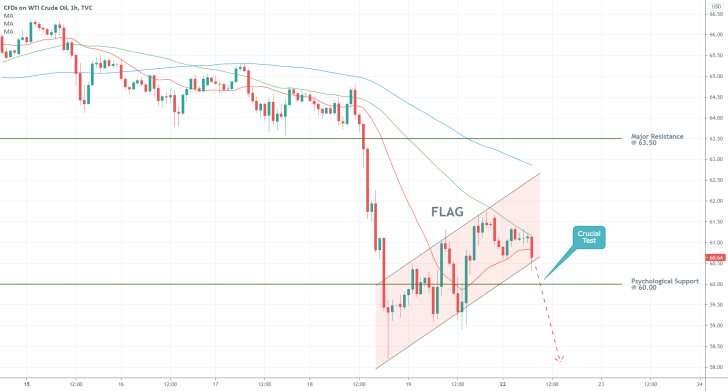
The hourly chart below studies in greater detail the currently emerging bullish pullback. As mentioned earlier, the peak of this pullback will present bears with an excellent opportunity to place their short orders at the best possible time. As shown, the pullback takes the form of a rising Flag. A break down below the Flag's lower boundary will signal that the market is ready to resume falling.
The price action appears to be concentrating below the 50-day MA, which serves as a floating resistance. For as long as this continues to be the case, the bears can expect an imminent breakdown. However, if the price action manages to shoot above the 50-day MA, this can allow the pullback to head towards the Flag's upper boundary.
The latter is currently converging with the 100-day MA, which also serves the role of a floating resistance. In other words, unless the price action manages to break down below the Flag's lower boundary in the next several hours, bears would likely have to look for selling opportunities near the 100-day MA.
3. Concluding Remarks:
More risk-averse bears can look for an opportunity to go short after the price action breaks down below the psychological support level at 60.00. In contrast, less risk-averse traders can look for an opportunity to sell, while the price action remains within the boundaries of the Flag.
The underlying risk associated with such actions is manifested by the likelihood of an adverse pullback to the major resistance level at 63.50. In other words, market bears should brace for potential fluctuations to that level. They should structure their SLs accordingly. Meanwhile, should the price of crude establish a decisive breakout above 63.50, this would signify the likely termination of the selling opportunity.
Crude Will Soon Be Ready to Resume Falling
The price of WTI recovered some of the initial losses that were caught by the original analysis and it's currently consolidating above the psychological support level at 60.00. Even still, the prevailing market sentiment remains ostensibly bearish, which presupposes the likely continuation of the development of a new downtrend after the current bullish correction is terminated.
Energy demand rose moderately at the end of last week following the publication of solid GDP numbers in the U.S. and promising industry data in the Eurozone. Despite the rising pace of global recovery, however, the sustained growth of energy prices is starting to be jeopardised by soaring inflation.
Prices are starting to rise rapidly across many sectors in the U.S., and many businesses are already sounding the alarm, worried that production is going to be impeded by higher costs.
#FED expects headline #inflation to rise moderately above 2.0% before swinging back. Yet, businesses are already starting to sound the alarm. The arising discrepancy is likely to unnerve #markets even more #StockMarket #trading #forex #tradingpsychology https://t.co/F5SMqYyNL3
— Trendsharks (@TrendsharksLive) March 30, 2021
Chair Jerome Powell and his colleagues at the Federal Reserve have been projecting an inflation rate 'moderately above' 2.0 per cent over the last couple of policy meetings. The FED expects to see headline inflation temporarily bouncing above the 2.0 per cent target level before retracing back; however, businesses are already getting fearful.
In the midst of all of this mounting uncertainty, bond yields continue to rise. The resulting discrepancy between FED policy and inflating expenses is likely to continue exacerbating market uncertainty, potentially compelling the FED to adopt a more hawkish policy stance much sooner than initially planned. All of these tensions are likely to have an adverse impact on the price of crude oil.
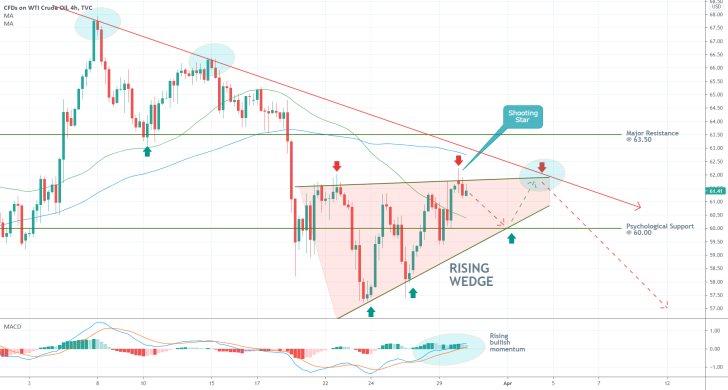
As can be seen on the 4H chart above, the aforementioned bullish correction is taking the form of an Ascending Wedge. This is a type of pattern that anticipates a forthcoming continuation in the development of an existing downtrend. However, some time may pass before a decisive breakdown occurs.
The price action has already bounced up and down from the two boundaries of the Wedge on two separate occasions, which means that it is likely to test each one at least once more before it breaks away from the pattern. Next, the price is expected to dive to the psychological support level at 60.00, which is likely to converge with the 50-day MA (in green) by that time, and the lower end of the Wedge, before it rebounds. The bullish correction then is likely to be terminated near the upper limit of the Wedge, which is expected to converge with the 100-day MA (in blue) and the descending trend line (in red).
The reading of the MACD indicator substantiates these expectations, given that the underlying bullish momentum is likely to continue appreciating in the short-term. That is why bears can start looking for an opportunity to sell the next time the price reaches the Wedge's upper boundary near 61.90. This would entail the implementation of trend-continuation trading strategies.
The Price of Crude Oil Toys with a Psychological Resistance
Bearish pressure continues to accumulate on the price of crude oil, despite growing demand worldwide. The prospects for a new bearish correction rise as investors become increasingly more concerned with the possibility of inflation getting out of hand.
The IMF is going to deliberate on the challenges to global recovery later today, as well as on the threat of a new debt trap. The massive fiscal stimulus that has been administered so far is helping the recovery in some countries to outpace the recuperation of others, thereby creating the risk of patchy and uneven global recovery.
The resulting uncertainty poses a considerable threat to crude oil, which continues to toy around the psychologically significant resistance (formally support) level at 60.00, as the underlying market bias remains undetermined. It is precisely this possibility of diverging global growth and widening gap between developed economies and emerging markets that could tip the price of crude.
Chiefly, rising concerns over a potentially uneven global recovery, complemented by rising yields, may bolster the emerging downtrend on the price of oil, driving the commodity's price towards the next psychologically significant target level - the 23.6 per cent Fibonacci retracement at 52.01.
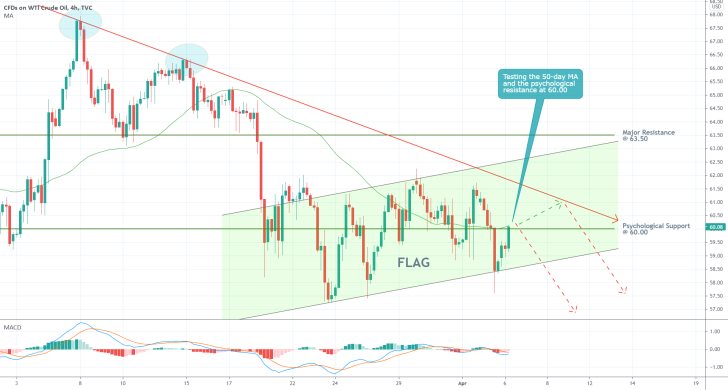
As can be seen on the 4H chart above, the underlying market sentiment remains mostly tilted to the downside. This is inferred from the fact that the price action remains concentrated below the descending trend line (in red). The recently observed fluctuations in a tight range represent a temporary break in the development of a broader downtrend. This is resulting in the establishment of a Flag pattern.
The price action evidently failed to break down below the lower boundary of the Flag (channel) yesterday, which means that the short-term bullish bias is not yet completely exhausted. As a consequence, the price action is currently testing the psychologically significant resistance level at 60.00. The latter is also converging with the 50-day MA (in green) at present.
Given the slowly rising bearish momentum, as underpinned by the MACD indicator, this short-term bullish bias is likely to be exhausted in one of two ways. The price action could either reverse immediately from the 60.00 resistance, or it could test the descending trend line one more time.
If the price action manages to break down below the Flag's lower boundary definitively, this will open up the possibility for renewed depreciation towards the aforementioned target level - the 23.6 per cent Fibonacci retracement at 52.01.
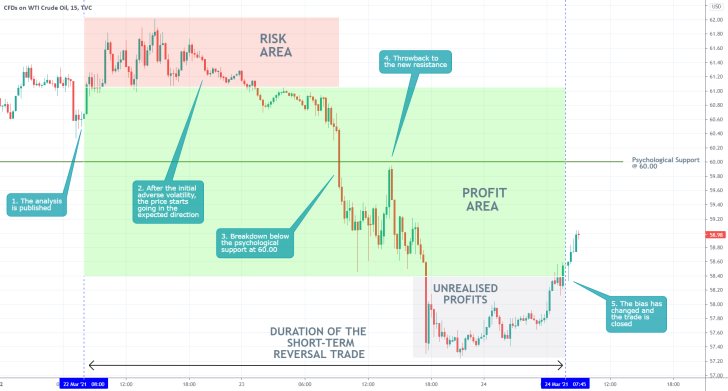
- The trade evolved exactly as per the expectations of the analysis. Shortly after its publication, the Flag was completed, and the price started diving. The trade was closed only after there were clear indications that the market sentiment has changed. The longer-term bearish opportunity remains.
- There aren't any major conclusions that can be drawn from this overall excellent execution. The only thing worth mentioning is the pullback to 60.00 after the preceding breakdown below the psychological support. A reminder that the price action tends to fluctuate around such major levels of support and resistance.
Disclaimer: Your capital is at risk! Trading and investing on the financial markets carries a significant risk of loss. Each material, shown on this website, is provided for educational purposes only. A perfect, 100% accurate method of analysis does not exist. If you make a decision to trade or invest, based on the information from this website, you will be doing it at your own risk. Under no circumstances is Trendsharks responsible for any capital losses or damages you might suffer, while using the company’s products and services. For more information read our Terms & Conditions and Risk Disclaimer.


