The AUDNZD recently attempted to develop a new bearish trend, but a resurgence of bullish pressure temporarily impeded this process. The strengthening of the Australian dollar was prompted by robust industrial data in China, which remains Australia's most important trade partner, coupled with the welcoming news concerning Moderna's progress in developing a vaccine against COVID-19.
There are, however, recent indications that the underlying buying pressure could be waning, which would mean that the bullish correction might come to an end because the overall market bias seems tilted towards the downside. The market bears are given another chance to take back control, which would increase the likelihood for the formation of a new bearish downtrend.
1. Long-Term Outlook:
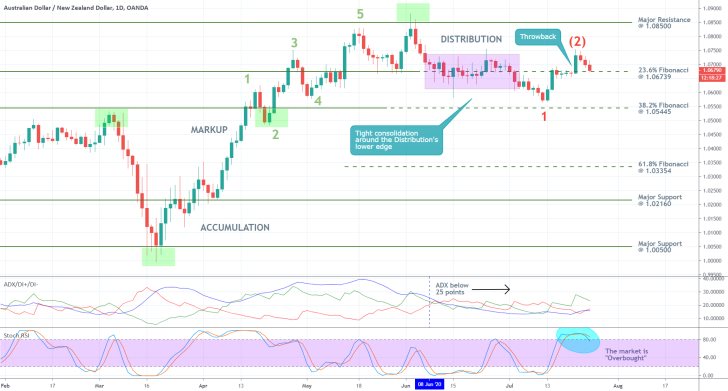
As can be seen on the daily chart below, the AUDNZD is currently trading in a narrow range between the major resistance level at 1.08500 and the 23.6 per cent Fibonacci retracement level at 1.06739. The last Distribution range, which is an integral component of a broader Wyckoff cycle, had the same boundaries. This means that the aforementioned bullish correction actually represents a throwback from the newly developing Markdown into the area of the Distribution range.
In other words, the underlying price action continues to consolidate around the 23.6 per cent Fibonacci retracement level in an undecided manner, preparing for the next big movement in either direction. Even though the price action's trading within the area of the Distribution range entails a possibility for a continued hike towards the major resistance level at 1.08500, the emergence of a bigger dropdown seems much likelier.
The existence of such protracted Distribution ranges typically signifies the gradual increase of underlying selling pressure, which eventually triggers the development of a new and significant bearish trend – a Markdown. Before this happens, however, the price action would have to definitively break down below the lower boundary of the Distribution range once more.
If the price action manages to break down below the 23.6 per cent Fibonacci retracement level, this would mean that the market could once again attempt to form a new and decisive Markdown. The first target level for such a development is encompassed by the 38.2 per cent Fibonacci retracement level at 1.05445. Concerning the longer-term, the next major goal is represented by the 61.8 per cent Fibonacci retracement at 1.03354.
Additionally, a breakdown below the Distribution's lower boundary would signify that the recent throwback is actually a false breakout. Furthermore, such a change in the underlying direction of the price action would also mean that a retracement leg (1-2) has just been concluded successfully. It follows that using the Elliott Wave Theory for reference, a new impulse leg (2-3) can be anticipated to drive the AUDNZD further down south. This assertion is congruent with the primary expectations for the formation of a new Markdown.

Additional confirmation of the main expectations can be derived from the ADX indicator. It has been threading below the 25-point benchmark since the 8th of June, which indicates strong-range trading conditions. These observations are inlined with the previously mentioned existence of the Distribution phase. Accordingly, the reading of the ADX represents the exact conditions that are to be expected prior to the emergence of a new directional trend.
The Stochastic RSI indicator has recently entered into the 'Overbought' extreme, which coupled with the range-trading environment manifested by the ADX, exemplifies very favourable conditions for a reversal in the direction of the price action. In other words, the AUDNZD seems to have reached a new peak, and is ready to resume trading lower. There is a confluence of the underlying signals suggesting the current transition of the market towards initiating the development of a new Markdown.
2. Short-Term Outlook:
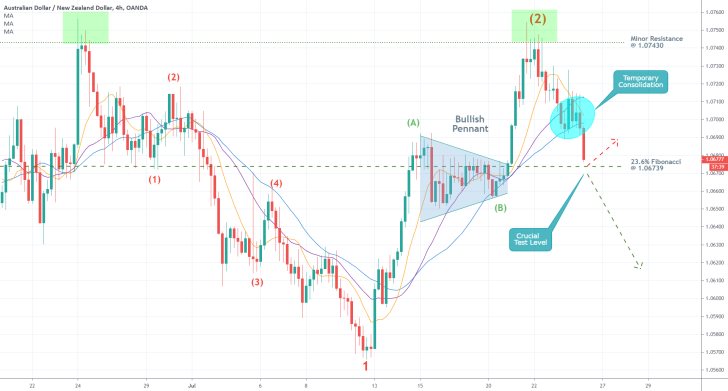
The recent behaviour of the price action, as illustrated on the 4H chart below, substantiates the claims regarding the market having reached a peak at point (2). Firstly, the AUDNZD has evidently rebounded from the minor resistance level at 1.07430, which is demonstrative of high selling pressure around that level.
Secondly, the broader retracement leg (1-2) encompasses a Bullish Pennant pattern, which was concluded after the price action rebounded from the aforementioned minor resistance level. This signifies that the previously bullish sentiment has now been changed with the prevailingly bearish sentiment in the short-term.
Thirdly, the breakdown below the temporary consolidation indicates the rising selling bias in the market. As can be seen, while this consolidation was developing, the price action was trading above the 30-day MA (in blue), but below the 10-day MA (in orange) and 20-day MA (in purple).
Once the breakdown took place, however, the price action started trading below all three MAs, which is highly demonstrative of this rising selling bias. Accordingly, the 10-day MA has recently crossed below the 20-day MA, which encompasses an early indication of the transformational change in the market that is currently unfolding. The underlying buying and selling pressures are presently finding a new equilibrium, which is going to affect the behaviour of the price action in the long run.
Concerning the short run, the AUDNZD could either break down below the 23.6 per cent Fibonacci retracement immediately or consolidate around the support level for some time before such a decisive breakdown occurs. This would depend on the exact amount of bearish commitment at present and would give market bears with an indication of just how soon this new Markdown could be expected to develop.

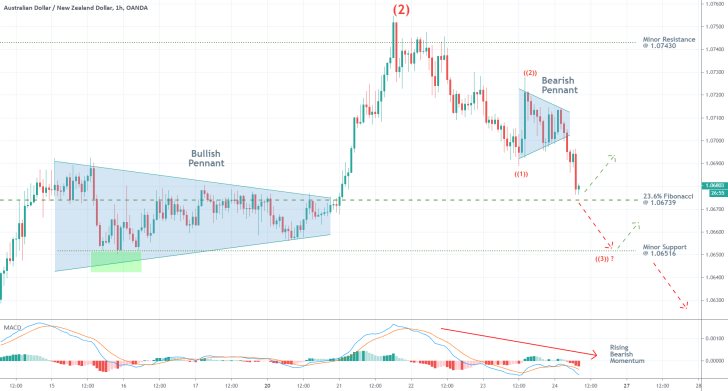
Finally, following the aforementioned reversal from the peak at point (2), the price action has started developing a new 1-5 impulse wave pattern as postulated by the Elliott Wave Theory. The Bearish Pennant on the hourly chart below outlines the first retracement leg ((1) – ((2)) of this new 1-5 wave pattern, which means that the market is presently moving forward towards establishing the next impulse leg ((2)) – ((3)).
Judging by the position and significance of the nearest support levels, such a bottom at point ((3)) could either take place around the 23.6 per cent Fibonacci (as argued above) or near the minor support level at 1.06516. Afterwards, the AUDNZD can be anticipated to form a new small retracement towards point ((4)), which would represent the pattern's second retracement leg. Finally, the third impulse leg ((4)) - ((5)) should drive the price action even further down south. All of these expectations are substantiated by the MACD indicator, which signals rising bearish momentum in the short-term.

3. Concluding Remarks:
The AUDNZD is projected to continue depreciating over the following days and weeks, following a recent reversal in its underlying direction. The bears who have not yet joined the market should wait for an opportune moment to do so preferably once the price action develops the next bullish correction.
Nevertheless, while the AUDNZD remains trading within the area of the broader Distribution range, the likelihood for intermittent fluctuations towards the range's upper boundary remains. Hence, the bears should be cautious as the market is not yet exhibiting solely bearish bias.

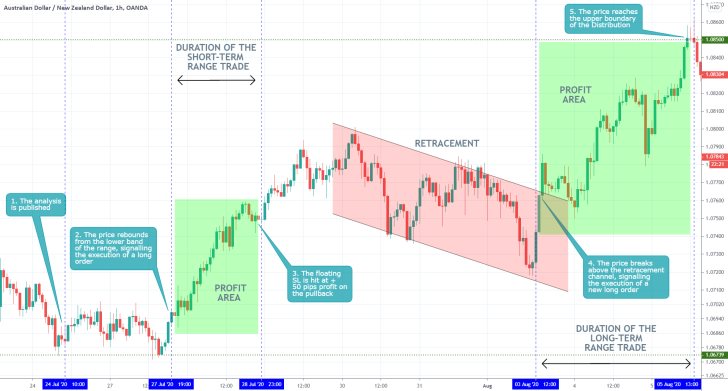
- he strongest aspect of the analysis was the technical portion – excellently drawn levels of support and resistance. Nevertheless, the fundamental reading of the underlying market sentiment was poorly done. Another solid part of the analysis was the recommendation for implementing range-trading strategies provided that the price rebounded from the lower boundary of the Distribution range, something that subsequently occurred.
Disclaimer: Your capital is at risk! Trading and investing on the financial markets carries a significant risk of loss. Each material, shown on this website, is provided for educational purposes only. A perfect, 100% accurate method of analysis does not exist. If you make a decision to trade or invest, based on the information from this website, you will be doing it at your own risk. Under no circumstances is Trendsharks responsible for any capital losses or damages you might suffer, while using the company’s products and services. For more information read our Terms & Conditions and Risk Disclaimer.


