A trader's job is to be constantly looking for congruency in all indicators that he or she uses when picking an asset for trading. When 2,3 or more underlying indicators all point to the same likely outcome concerning the price action of a particular asset, the probability of the market panning out in that way is increased. In other words, the decision whether to buy or to sell a specific asset should be based on the information drawn from several different indicators, all of which point in the same direction.
This is currently being the case with the AUDJPY pair, which is exhibiting a very particular behaviour that is being picked up by various indicators with diverging underlying orientations. The pair is currently being affected by the most recent global developments while its underlying price action is exhibiting classic behavioural traits, all of which is suitable for the implementation of one very particular trading approach.
That is why the purpose of today's analysis is to examine the nature of the underlying range-trading environment that has been observed over the past several trading days, and to highlight the most likely transition of the market into new trending environment once the breakout play is concluded.
1. Long Term Outlook:
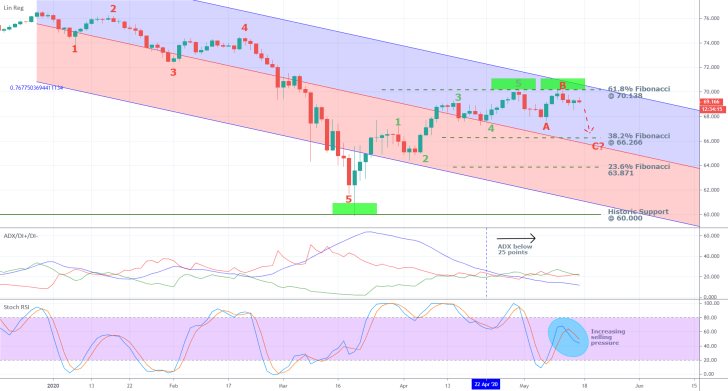
As can be seen on the daily chart below, the pair has recently finished establishing a 1-5 impulse wave pattern, which highlights the bullish uptrend following the coronavirus market crash of early March. Currently, the price action appears to be developing an adverse ABC correction, which is likely to drive the AUDJPY lower once again.
The aforementioned congruency of all underlying indicators seems to suggest the likely forthcoming dropdown in the price action, as the general market sentiment becomes increasingly more bearish. The fact that the previous bullish 1-5 impulse wave pattern is now concluded is by itself an indication signifying the market's likely transition into a new bearish trend next.
This assertion is further supported by the fact that the pattern has been terminated just below the 61.8 per cent Fibonacci retracement level at 70.138, which is a major resistance level and thereby a very probably turning point for the underlying direction of the price action. Moreover, the price action has reached the upper limit of a downwards sloping channel, which, too, could serve as a turning point for the underlying direction of the price action. Hence, the fact that all three developments have coincided around relatively the same price level is a significant indication underscoring the substantial bearish sentiment in the market, which, in turn, is likely to be followed by the establishment of a new Markdown.

The ADX is currently threading below 25 points, which means that the market finds itself in a distinctive range-trading environment. Under such conditions, the expectation for a turnaround in the underlying direction of the price action around keystone levels is even more substantiated.
This makes the aforementioned expectation for the emergence of a new Markdown around the current market price even more probable. Additionally, the Stochastic RSI has recently registered a new bearish crossover, which is yet another indication favouring the general expectations, as the selling pressure in the market continues to increase.
The first target for such a new bearish trend would be the 38.2 per cent Fibonacci retracement level at 66.266, which is close to the channel's middle line. This is where the ABC correction is likely to be terminated. Meanwhile, the second target for a potential new bearish trend is naturally going to be the 23.6 per cent Fibonacci retracement level at 63.871.
2. Fundamental Outlook:
As it was argued in our 'Markets' Segment from yesterday, investors have started to weigh in on whether or not the majority of US stocks are currently being overvalued, following Jerome Powell's recent remarks. Yesterday the yield of the 10-years Government Bond plummeted as many investors fearing a new market crash started fleeing to the treasuries market. As a side effect of this behaviour, it could also be anticipated for the aggregated demand for safe-havens to surge as well.
The yen is one such widely recognised safe-haven asset, which is why the demand for it is likely to be bolstered over the next several days as the situation develops. Consequently, the observed underlying fundamentals, too, are inlined with the aforementioned assertions and seem to favour the emergence of a new bearish trend on the AUDJPY.
3. Short Term Outlook:

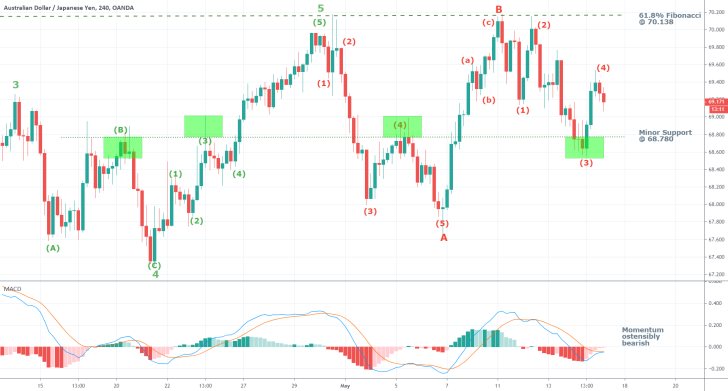
As can be seen on the 4H chart above, every separate swing has been characterised using Elliott Wave Theory on a lesser timescale. This makes future projections of probable swing lows and swing highs possible. Utilising EWT, it can be discerned that a new bearish (4)-(5) impulse leg is due to be established, likely falling below the minor support level at 68.780.
Additionally, the MACD in the short term illustrates the ostensibly bearish momentum, which is likely to continue increasing. This, too, favours the prevailing anticipations for the price action to continue heading lower.
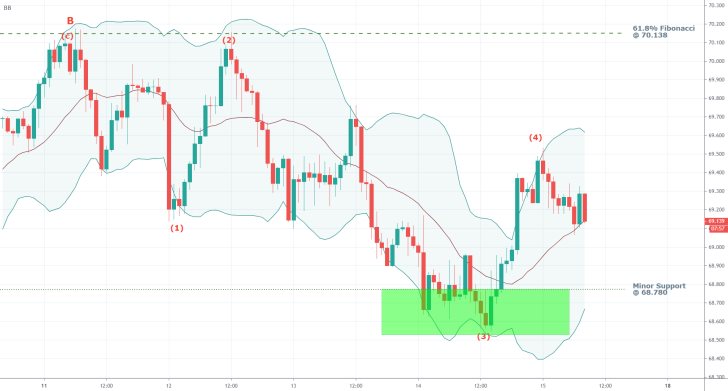
Meanwhile, the price action is consolidating above the middle line of the Bollinger Bands on the hourly chart below. This behaviour is demonstrative of existing bullish sentiment in the very short term. The price action would have to break down below it before this sentiment can be considered to be invalidated. Meanwhile, the Bollinger Bands themselves appear to be contracting, which underscores the diminishing levels of adverse volatility in the market and is favourable for the expectation of a new bearish trend's development.

4. Concluding Remarks:
Almost all of the underlying indicators and observations of the price action's behaviour seem to suggest the same thing – the AUDJPY is likely to change its direction and start falling down. Even still, however, traders should not be too quick to jump the gun, as there are no guarantees in the market. Even a 100 per cent congruency may not ultimately lead to the market behaving in an anticipated manner.

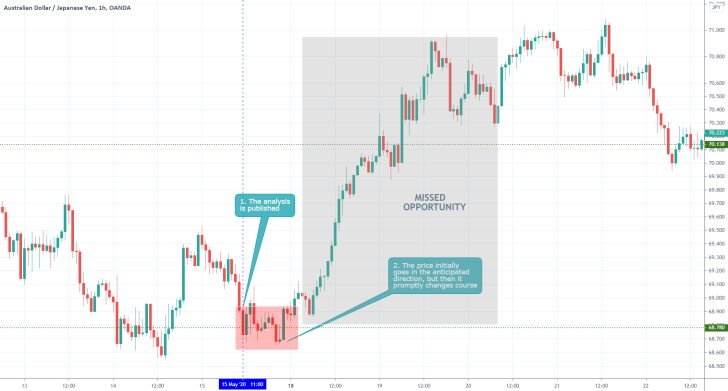
- The analysis failed in both its short-term and long-term projections. That is why the use of tight and consistent risk management techniques is so vital in trading. Without those, a lot more losses could have been incurred given the misinterpreted market sentiment. After such failed analyses, it is better for traders to take several days break from trading, so that they can recharge.
Disclaimer: Your capital is at risk! Trading and investing on the financial markets carries a significant risk of loss. Each material, shown on this website, is provided for educational purposes only. A perfect, 100% accurate method of analysis does not exist. If you make a decision to trade or invest, based on the information from this website, you will be doing it at your own risk. Under no circumstances is Trendsharks responsible for any capital losses or damages you might suffer, while using the company’s products and services. For more information read our Terms & Conditions and Risk Disclaimer.


