The GBPUSD is forming a new downtrend, despite the fact that the pound, bolstered by robust economic data in the U.K., continues to show resilience to the mounting bearish pressure. That is why other currency pairs involving the greenback have already dived more than the cable has, but even the GBPUSD is starting to be affected by changing market sentiment more noticeably.
Rising global prices are likely to stave off the rally of the energy market because of higher costs to production, despite the steady global recovery. Therefore, the demand for the dollar is only likely to continue growing in the foreseeable future, parallel to the rising bond yields in the U.S.
The underlying fundamentals seem to be favouring the continuation of GBPUSD's downtrend development, despite a recent bullish correction. That is why today's analysis is examining the current trend-continuation setup.
1. Long-Term Outlook:
As can be seen on the daily chart below, the emergence of a new downtrend represents a breakout from the existing regression trend. After breaking down below the channel's lower boundary, the price action established a minor bullish pullback to the same boundary (from below), which climaxed yesterday. It left behind a Shooting Star candle, which substantiates the expectations for continued price depreciation.
Before that, the newly emerging downtrend's significance was confirmed after the price action had consolidated below the psychological resistance level at 1.40000 and the middle line of the regression trend. Meanwhile, yesterday's rebound from the lower boundary of the channel (regression trend) was made even more significant by the fact that the boundary was converging at that time with the 50-day MA (in green), which currently acts as a floating resistance.
All of this seems to imply that the bullish pullback has already peaked and that the price action is ready to resume falling. This creates ideal conditions for the implementation of trend-continuation trading strategies. Next, the downtrend is likely to target the 23.6 per cent Fibonacci retracement level at 1.35765, which encapsulates the closest barrier with psychological importance. Moreover, the Fibonacci support was recently crossed by the 100-day MA (in blue), serving as a floating support. This raises the prominence of the former even more.
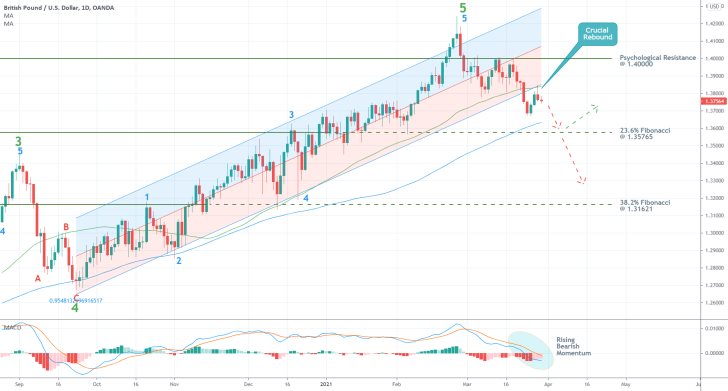
The longer-term bearish outlook is additionally bolstered by the fact that the preceding uptrend represents a major 1-5 impulse wave pattern (in green), as postulated by the Elliott Wave Theory. Because the pattern was concluded at the previous swing high, the bears are now free to retain more control. This is additionally underpinned by the MACD indicator, which is showing mounting bearish momentum.
As stated earlier, the 23.6 per cent Fibonacci encapsulates the first target for the reinvigorated bearish trend. If the price manages to break lower, then it is likely to continue depreciating towards the 38.2 per cent Fibonacci at 1.31621, provided that the underlying bearish bias is not completely exhausted by that time. Conversely, bulls would be hoping for a check to the bearish pressure much sooner than that, again around 1.35765.
2. Short-Term Outlook:
The biggest indication of the rapidly rising bearish pressure can be seen on the 4H chart below. The GBPUSD managed to break down below the consolidation range (in green), spanning between the psychological resistance at 1.40000 and the major resistance (previously support) at 1.38200, which confirms this.
Notice that the price action had previously tested the upper boundary of the range on three separate occasions, whereas it managed to break down below its lower edge on the third attempt. It follows that the aforementioned bullish pullback actually serves the role of a throwback to this lower limit (now from below), thereby confirming the broader bearish expectations.
The throwback was exhausted not only from the 1.38200 resistance but also from the 50-day MA (in green). This rebound from the moving average substantiates the expectations for continued price depreciation. Nevertheless, this does not imply an immediate dropdown, as more fluctuations around the resistance are plausible.
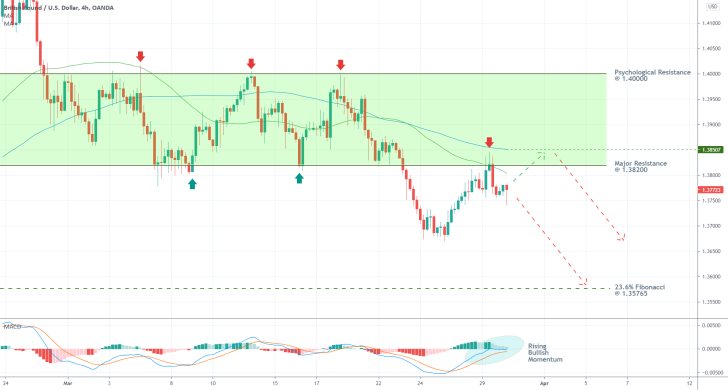
The price action could attempt one last-ditch attempt at breaking higher towards the 100-day MA (currently turning horizontal at 1.38500) before the downtrend is resumed. The prevalence of bullish momentum in the short-term is once again inferred from the MACD indicator.
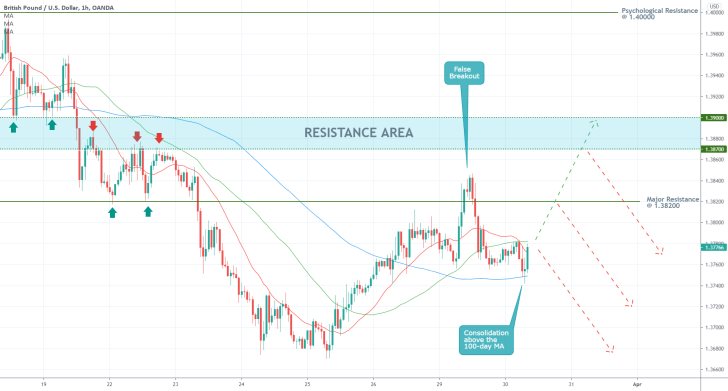
The hourly chart below examines the different possibilities for the eventual emergence of a decisive breakdown from the current bullish correction. These are projected in relation to the false breakout above the major resistance at 1.38200 and the subsequent consolidation of the price action above the 100-day MA.
Unless the price action manages to rebound yet again from the convergence of the 20-day MA (in red) and the 50-day MA in the immediate future, it could climb towards 1.38200 before such a reversal takes place. Finally, the price action may rise as high as the Resistance Area's lower boundary (in blue) at 1.38700 before bears regain control.
3. Concluding Remarks:
Bears should consider each of these three possibilities carefully and structure their selling orders depending on their risk-aversion level. Less risk-averse traders may choose to sell around the current market price, whereas more careful traders can wait and see whether the bullish correction's peak is extended higher.
Once again, the current setup looks suitable for the implementation of trend-continuation strategies, which means that bears should be looking to sell around the peak of the current swing high. As regards risk management, they should consider placing their stop-losses somewhere close (above) the resulting peak.
GBPUSD's Bullish Upswing Running on Fumes
GBPUSD continues to establish its bullish correction, though the underlying buying pressure appears to be reaching its peak. This means that the broader bearish trend is likely to be reinvigorated soon.
Liquidity levels in the Foreign Exchange continue to be diminished today because of the Bank Holiday in Europe, leaving many markets closed for the day. With low trading activity, the price of the GBPUSD is consolidating in a very narrow range, thereby creating a minor bottleneck. The latter is likely to be broken tomorrow when the overall trading volume starts returning to normal. In other words, traders can brace for another major price swing to begin developing from tomorrow.
As regards the underlying fundamental factors at present, the U.S. dollar is continuously strengthening. This trend is brought about by robust employment data in the U.S., supplemented by faster-than-expected growth. Additionally, the greenback's rally is further supported by rising yields in the bonds market.
Meanwhile, the pound's persisting strength also stems from solid growth and employment numbers. However, the overall bearish pressure on the GBPUSD is still mounting, which presupposes the likely continuation of the broader downtrend's development after the current upswing is terminated.
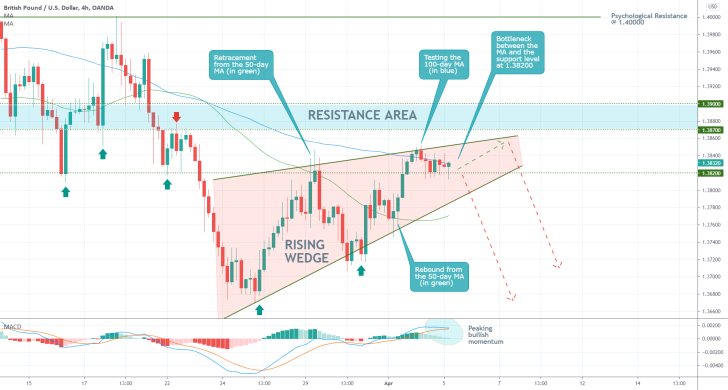
As can be seen on the 4H chart above, the current bullish correction on the GBPUSD indeed appears to be reaching a climax. Such a tipping point is likely to be elucidated by the completion of the Rising Wedge pattern, which in itself signifies the likely continuation of a prevailing downtrend.
It would take a decisive breakdown below the Wedge's lower boundary and the minor support level at 1.38200 to confirm the downtrend's resumed development. Before that, however, the price action could test the Wedge's upper boundary, which is about to converge with the lower boundary of the Resistance Area (in blue) at 1.38700, one more time.
Such a turn of events would be underpinned by a false breakout away from the current bottleneck (spanning between the 1.38200 support and the 100-day MA (in blue). In other words, market bears should be prepared to face a potential upswing towards 1.38700 one more time before the bullish correction gets terminated. This assertion is further supported by the current reading of the MACD indicator, which underscores peaking bullish momentum. This represents a likely precursor to a forthcoming bearish crossover; however, it leaves some room for potential upticks beforehand.
Waiting for the End of the Bullish Correction
The GBPUSD started developing a minor bullish correction recently, which could potentially lead to the termination of the preceding bearish trend if there is enough selling pressure in the market. However, there are plenty of reasons to expect the opposite.
This means that there are excellent opportunities for implementing trend continuation trading strategies once the correction reaches a peak. In other words, bears will be looking for a chance to sell at the resulting swing peak.
These expectations are further substantiated by the fact that the underlying fundamentals are mostly bearish oriented. The highly anticipated U.S. inflation data, which is scheduled for publication later today, is expected to strengthen the greenback. Rising consumer prices correlate to heightened demand for the currency, which is why the cable is likely to be boosted later into today's session.
The underlying question is how much further north could the current bullish correction be extended before the bears regain control?
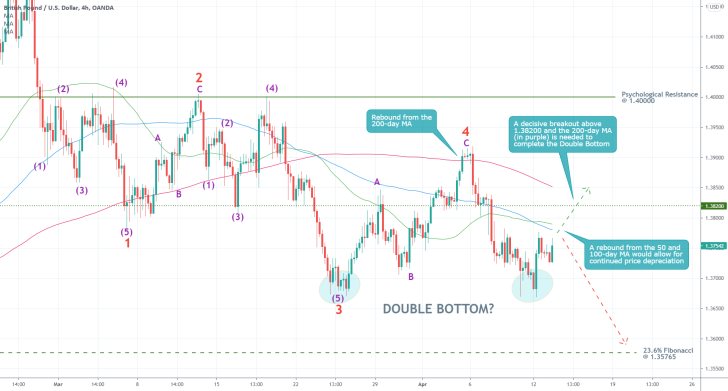
As can be seen on the 4H chart above, the bullish correction emerged from the latest dip. This appears to have begun developing a Double Bottom pattern, which is typically perceived as a trend reversal pattern. However, it would take a decisive breakout above 1.38200 and the 200-day MA (in purple) to confirm the beginning of such a new uptrend.
On the other hand, a potential rebound from the currently converging 50-day MA (in green) and 100-day MA (in blue), which serve as floating resistances, would likely demonstrate the end of the bullish correction. Such a rebound would invalidate the bullish expectations connected to the Double Bottom and would reinstate the broader bearish expectations relating to the Elliott Wave Theory.
The price action is currently in the process of establishing a broad 1-5 impulse wave pattern (in red), which substantiates the primary expectations. Namely, that the price action is due to complete the final impulse leg of the pattern (4-5), which could drive the price action lower towards the next psychological support - the 23.6 per cent Fibonacci retracement level at 1.35765.
Hence, bears could look for an opportunity to sell on the condition that the price action does rebound from the two moving averages, whereas market bulls should wait for a potential breakout above 1.38200 before they can go long.
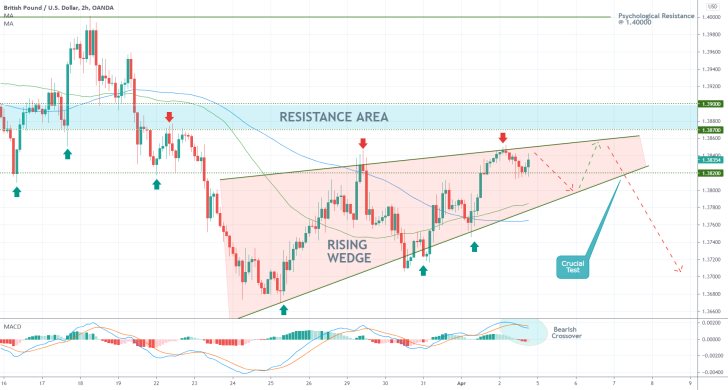
- The GBPUSD started appreciating towards the Resistance Area (in blue), as per the expectations of the analysis. The price action is currently concentrating just below the upper boundary of the unfolding Rising Wedge pattern, which presupposes the likely emergence of a new downswing. It would take a decisive breakdown below the lower boundary of the Wedge to confirm the further continuation of the broader downtrend.
- Bears should keep in mind that the price action is also concentrating above the 1.38200 support level at present, which could potentially lead to the termination of the selling opportunity if a downswing does not emerge soon.
- The crossover of the 50-day MA (in green) above the 100-day MA (in blue) represents another bullish signal (both of them, currently converging towards the lower boundary of the Wedge, also serve as floating resistances), while the recent crossover on the MACD represents a bearish indication.
- So far, the behaviour of the price action is meeting the initial expectations of the analysis, as it consolidates in a range between 1.38200 and the Resistance Area. However, as stated earlier, it would take a decisive breakdown below the Wedge (and 1.38200) to confirm the longer-term bearish forecasts.
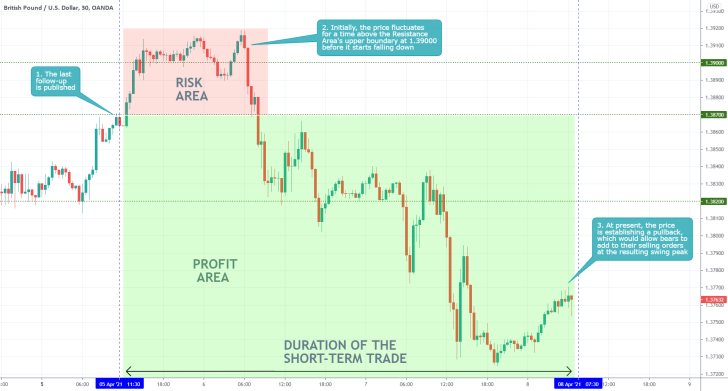
- The expectations of the last follow-up are so far being realised almost perfectly. Despite an initially bigger-than-anticipated upswing above the 1.39000 resistance, the price action promptly changed directions and started diving. It began establishing a new downtrend, which continues to entail trading opportunities for bears.
- Chiefly, the price action appears to be establishing a minor bullish pullback, which can be used by bears by means of applying trend-continuation strategies. They can wait for the pullback to peak at a new high, so that they can add to their selling orders in anticipation of further price depreciation.
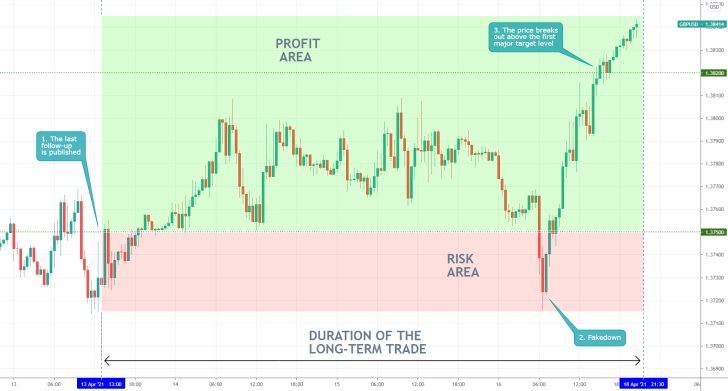
- The GBPUSD resumed advancing higher into a new bullish correction, following the publication of the last follow-up. The most notable development was the emergence of the fakedown, which could have misled some traders into opening new selling orders.
- The best way to gauge the risk of such adverse fluctuations is to wait and see where the price closes on the 1H, 4H, 1D charts. Using charts with bigger timeframes allows traders to better perceive the current behaviour of the price action in relation to the general market uncertainty.
Disclaimer: Your capital is at risk! Trading and investing on the financial markets carries a significant risk of loss. Each material, shown on this website, is provided for educational purposes only. A perfect, 100% accurate method of analysis does not exist. If you make a decision to trade or invest, based on the information from this website, you will be doing it at your own risk. Under no circumstances is Trendsharks responsible for any capital losses or damages you might suffer, while using the company’s products and services. For more information read our Terms & Conditions and Risk Disclaimer.


