The German financial services company's stock has been consolidating in a narrow range for six consecutive days. The reason for the muted price action stems from the anticipations that were building up over the last several days, concerning the state of the German industry, and in particular the German services sector.
Investors were eagerly awaiting the release of the crucial Services PMI data before they could decide whether or not a recuperated German industry could propel Allianz's share price higher. The German services and manufacturing PMI numbers came in earlier today, and they were much better than initially expected.
Given this solid performance, European investors' optimism is now likely to be bolstered, which is going to affect the company's stock positively. A new rally is also expected to be supported by the strengthening euro.
Due to these favourable fundamentals, the share price of Allianz is likely to break out above the previously mentioned consolidation range and resume trading further north. That is why the purpose of today's analysis is to examine the current market setup, and to underline the manner in which this is likely to happen.
1. Long-Term Outlook:
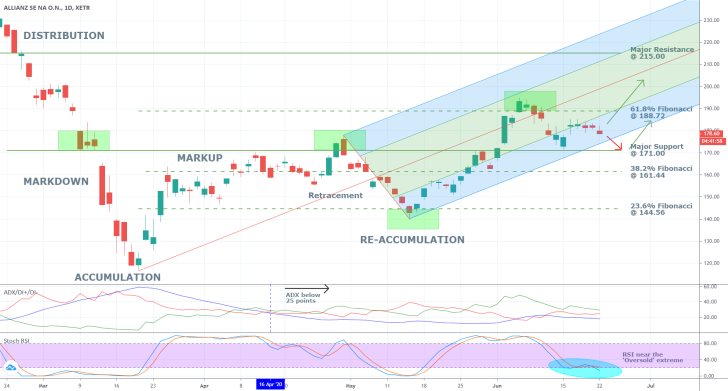
As can be seen on the daily chart below, the price action has been developing a new Markup ever since the last Re-Accumulation was concluded. However, this process was interrupted when a minor retracement to the pitchfork tool's lowest boundary was subsequently followed by the aforementioned consolidation range. The price action is currently contained within the pitchfork's lowest area (in blue).
In this long-term context, the most recent price action exhibits typical behaviour, which is to be expected in a bullish market. Arguably, the most important price level on the daily chart is found at the 171.00 mark. After the price action managed to break out above it a couple of weeks ago, it turned into a prominent support level. So, it is not surprising that the price action subsequently retraced back to it, which represents the confirmation of the new support level that commonly follows such significant breakouts. Moreover, the swing low of the retracement encompasses an ideal opportunity for bulls to join the market before the rally resumes.

Before this happens, however, the price action could fall back to the major support level at 171.00 one more time. Even still, this appears less likely, seeing as how the pitchfork's lowest boundary is already positioned higher than the support level itself.
Breaking out above the 61.8 per cent Fibonacci retracement level at 188.72 is going to be the first significant challenge for the renewed upswing. That is so because this psychological resistance currently coincides with one of the pitchfork's inner boundaries.
The ADX has been threading below the 25-point mark since the 16th of April, which means that the market is prevailingly range-trading. So, the newly developing bullish trend is likely to be characterised by adverse price fluctuations, at least initially. Moreover, the Stochastic RSI is threading just above the 'Oversold' extreme, which could prompt heightened buying pressure around the current market price.
2. Short-Term Outlook:
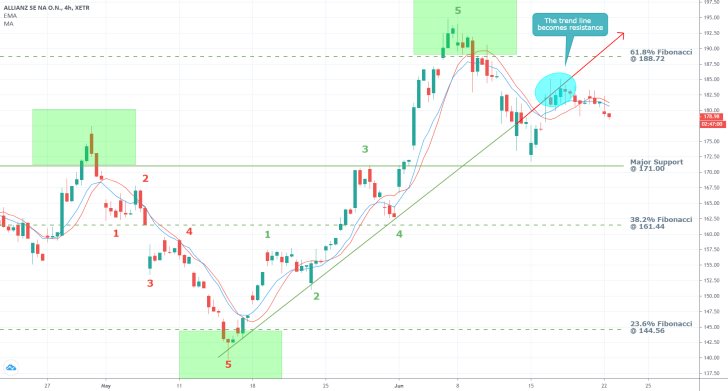
Before the market bulls decide to go long on the stock, however, they should consider the 4H chart below. The price action has recently concluded establishing a minor 1-5 impulse wave pattern, which is postulated by the Elliott Wave Theory. What this entails is that, at least in the short run, the underlying bullish commitment might be waning.
The ascending trend line, which previously served as intermediate support during the establishment of the last 1-5 impulse wave pattern, is presently serving as an intermediate resistance. The area in blue demonstrates this perfectly, as the price action failed to bounce back up, and above the trend line. All of this implies that the aforementioned retracement (the downswing that was initiated from the peak at 5) may not be over yet.
Additionally, the 10-day EMA (in blue) has crossed below the 10-day MA (in red), which elucidates the prevalence of bearish sentiment over bullish sentiment in the very short run. For as long as the price action remains below the two moving averages, this relationship is going to be preserved.

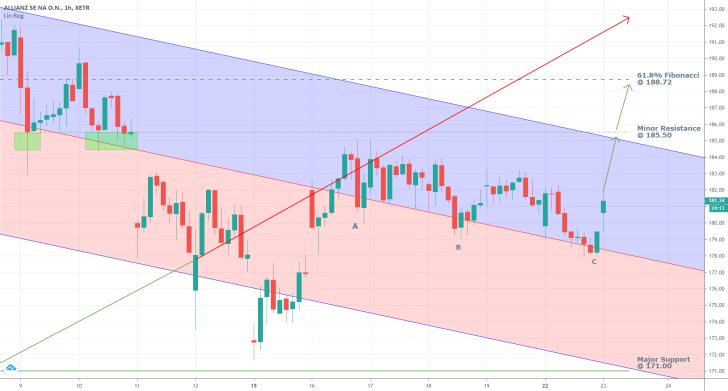
The hourly chart below illustrates the behaviour of the price action in the very short term. Despite the fact that it had failed to break out above the ascending trend line, it has also been able to remain threading in the upper part of the descending channel. The three points of contact (A, B, and C) pinpoint the three distinct times the price action could have broken down within the lower portion of the channel. However, evidently, the underlying bullish commitment has prevented this from happening.
The price action could either resume depreciating just above the channel's middle line in the immediate future before the market gets fully ready to continue trading higher, or it could do so right away. In the short run, such a new uptrend is first of all going to have to break out above the channel's upper boundary, which at present coincides with the minor resistance level at 185.50. Once this is done, the next clear target level would be the 61.8 per cent Fibonacci retracement level at 188.72, as was mentioned earlier.

3. Concluding Remarks:
The share price of Allianz is very probably going to benefit from the underlying fundamental factors that were described in the introduction. Judging on the market setup that is presented on the larger-scale charts, the price action should resume trading higher after the retracement is concluded. The analysis of the shorter-term charts, however, reveals that this process may not be completed as of yet.

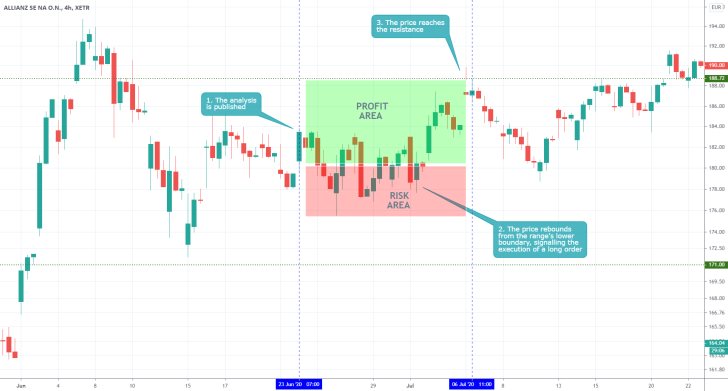
- The long-term expectations of the analysis were not realised because the share price did not establish a new uptrend. Nevertheless, the price did form a new upswing, which reached the suggested resistance level. Executing a long order in a ranging market is still justified when done right – buying in close to the lower end of the range itself.
Disclaimer: Your capital is at risk! Trading and investing on the financial markets carries a significant risk of loss. Each material, shown on this website, is provided for educational purposes only. A perfect, 100% accurate method of analysis does not exist. If you make a decision to trade or invest, based on the information from this website, you will be doing it at your own risk. Under no circumstances is Trendsharks responsible for any capital losses or damages you might suffer, while using the company’s products and services. For more information read our Terms & Conditions and Risk Disclaimer.


