The precious commodity finds itself in a solid bearish market at present, which is owing to the heightened demand for riskier assets amongst global investors. The latter stems from the fact that U.S. yields remain at historically low levels due to FED's massively accommodative monetary policy stance. The high energy prices currently represent another contributing factor.
While the longer-term forecasts remain ostensibly bearish, gold's price action looks poised to have a temporary respite in the immediate future. The safe-haven tested the pivotal support at 1780.00 for a second time recently and has subsequently rebounded from it yet again. The currently emerging bullish correction is likely to drive the price action higher towards the next resistance before the broader downtrend can be resumed.
These expectations for a potential bullish pullback are further substantiated by the fact that this week is going to be relatively uneventful, allowing for trading action to ease up momentarily. Overall, the underlying fundamentals seem tilted towards the upside in the short-term; however, the longer-term outlook remains decidedly bearish.
1. Long-Term Outlook:
As can be seen on the daily chart below, the entire downtrend (so far) has been behaving as per the expectations of the Elliott Wave Theory. Namely, the initial bearish 1-5 impulse wave pattern (in red) was followed by an interim bullish 1-5 impulse wave pattern (in green), which, in turn, is now being followed by yet another bearish 1-5 pattern. So far, the price action appears to have concluded only the second impulse leg (2-3), which means that it is time for another retracement (3-4). This is inlined with the aforementioned expectations for another bullish correction.
Notice that the current dip at 3 is on the same plane as the last dip at 5 (the green rectangle), implying that the price action could have temporarily bottomed out near the 1780.00 support. Meanwhile, the bullish 1-5 pattern's peak at 5 was below the preceding pattern's swing high at 4 (the two are highlighted in light blue), which confirms the prevalence of the broader bearish sentiment in the market.
The ADX indicator has been threading below the 25-point benchmark from the 14th of December until the 17th of February, which means that the trending environment is not yet quite robust. In other words, a bullish pullback emerging from the 1780.00 support seems probable at present. Moreover, the Stochastic RSI indicator is currently signalling that gold is oversold, which implies a likely resurgence of buying pressure in the near future.
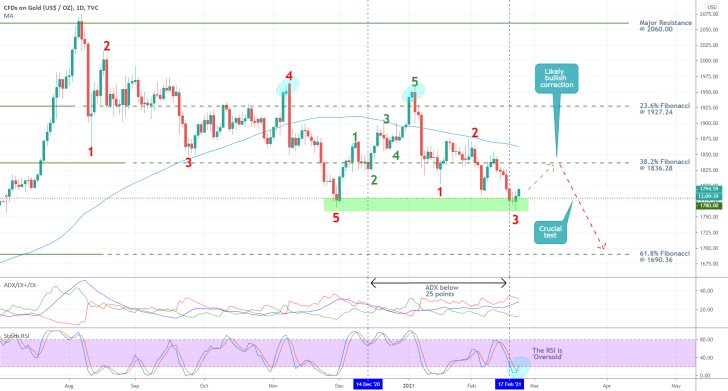
A potential bullish correction could rise as high as the 38.2 per cent Fibonacci retracement level at 1836.28 before the bears regain control. In addition to being the next psychological resistance level, the 38.2 per cent Fibonacci is about to be crossed by the 100-day MA (in blue) soon. The latter serves the role of a prominent floating resistance, which would make the 1836.28 level an even more pronounced turning point.
Unless the underlying market sentiment changes and the price action manages to break out above 1836.28, a bearish rebound from the 38.2 per cent Fibonacci is likely to throw the price action back towards the 1780.00 support. If it manages to break below that support on its third attempt, the price action would then be able to dive towards the next psychological target level - the 61.8 per cent Fibonacci at 1690.36.
2. Short-Term Outlook:
Despite the overwhelmingly strong bearish sentiment in the long-term, the situation looks less decisive on the 4H chart below. The price action is currently in the process of developing a Falling Wedge, which represents a pattern that typically entails rising bullish bias. In other words, market bears should monitor the behaviour of the emerging bullish correction carefully because it could potentially lead to a new uptrend.
A breakout above the wedge's upper boundary would represent the first such test for the potential development of a new bullish trend. Another decisive breakout above the 38.2 per cent Fibonacci (second test) would, in turn, confirm the strength of such a newly emerging uptrend. Meanwhile, bears would be looking for signs of bullish exhaustion near the wedge's upper boundary or the Fibonacci resistance.
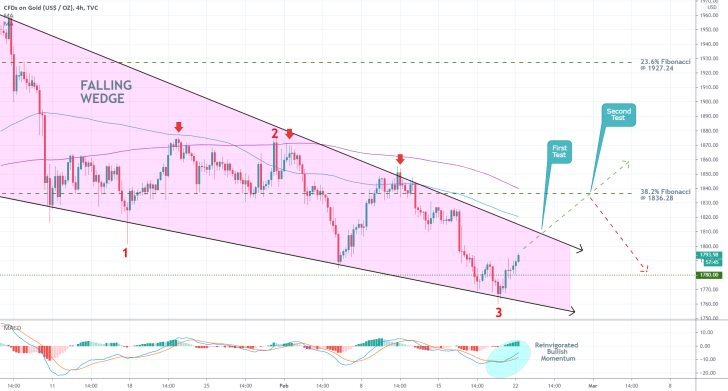
Notice that while the short-term momentum is becoming increasingly bullish-looking, the price action remains concentrated below the 100-day MA (in blue) and the 200-day MA (purple). While this relationship between the three continues to be active, the broader sentiment will remain bearishly oriented. Nevertheless, market bears should be prepared to deal with potential bullish pullbacks to the 200-day MA, which is currently converging with the 38.2 per cent Fibonacci.
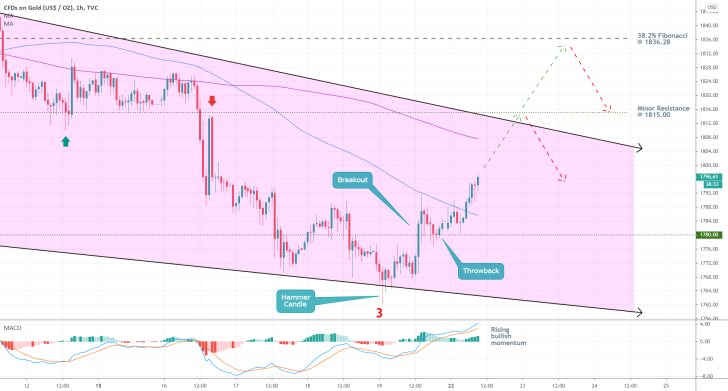
Looking at the hourly chart below, the nature of the currently emerging bullish correction becomes clearer. It began with a Hammer Candlestick's development at the dip, followed by a breakout above 1780.00. The subsequent throwback to the support elucidated the rising bullish pressure in the short-term, which is also demonstrated by the MACD indicator.
As mentioned earlier, the correction is about to be first tested around the wedge's upper boundary, which is currently converging with the minor resistance level at 1815.00. If the price breaks higher, the next test will be at the 38.2 per cent Fibonacci.
3. Concluding Remarks:
It is extremely risky for bulls wanting to take advantage of the emerging correction to join the market at present. They should keep in mind that the underlying sentiment remains ostensibly bearish. While their opportunities for trading in the short-term are limited, bulls can wait and see whether the price action manages to break out above 1836.28. If it does, they will be able to apply trend-continuation strategies on the next throwback to the 1836.28 level from above as a support.
In contrast, bears can wait for the bullish correction to be exhausted near one of the above-mentioned levels before they can look for an opportunity to sell at the resulting swing high. In doing so, they will be eyeing a chance to join the reinstated downtrend.
Gold Bears Need to Play the Waiting Game
The price of gold currently finds itself in a strong bearish downtrend. The commodity has difficult times due to a string of contributing factors. Central banks have started to observe improving economic conditions globally, though the prospects for bumpy and uneven recovery remain very much active. The worldwide vaccine rollout and accommodative fiscal support are strengthening investors' sentiment. This trend is manifested by the growing demand for riskier assets.
Consequently, the yields of U.S. Treasury Notes are finally rising, following months of persistent lows, as uncertainty and fear subside. Meanwhile, the demand for low-risk securities is waning parallel to the surging interest for higher-risk assets. As the most popular safe-haven security globally, gold is unsurprisingly hit the hardest by these developments.
The price of the commodity looks poised to continue sliding in the near future as investors and traders become even more excited. Despite this rising bearish bias, however, bears should exercise caution. They should wait for the price action to conclude the next bullish pullback before looking to enter short on the broader downtrend.
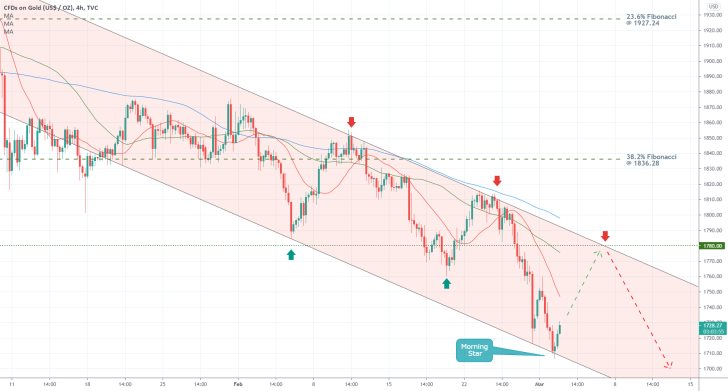
As can be seen on the 4H chart above, the underlying price action continues to be concentrated within the boundaries of a descending channel. Nevertheless, there are plenty of reasons to expect at least a minor bullish pullback in the immediate future.
After touching the channel's lower boundary during today's trading session, the price action developed a Morning Star pattern, which is commonly taken to represent mounting bullish pressure. Seeing as how this pattern emerged at the latest swing low, a temporary bullish rebound seems like the most plausible outcome.
Similar bullish corrections in the past have extended to the upper boundary of the channel on two separate occasions (indicated by the red arrows), which is why the same can be expected now. Notice that at present, this upper edge of the channel is converging with the major resistance level at 1780.00. The patter previously served as a prominent support, which is why a bullish pullback to it seems like the likeliest future development.
While the three moving averages continue to maintain a perfect descending order - the 20-day MA (in red) trading below the 50-day MA (in green), which is positioned below the 100-day MA (in blue) - this does not negate the possibility of a bullish correction. Quite the contrary, the 100-day MA's convergence towards the upper border of the channel represents yet another reason for the emergence of such a pullback.
Overall, bears can look for an opportunity to implement trend-continuation strategies once the price action nears 1780.00 or the channel's upper boundary. They can try to sell at the resulting swing peak, thereby joining the existing bearish downtrend before the price action gets ready to resume falling.
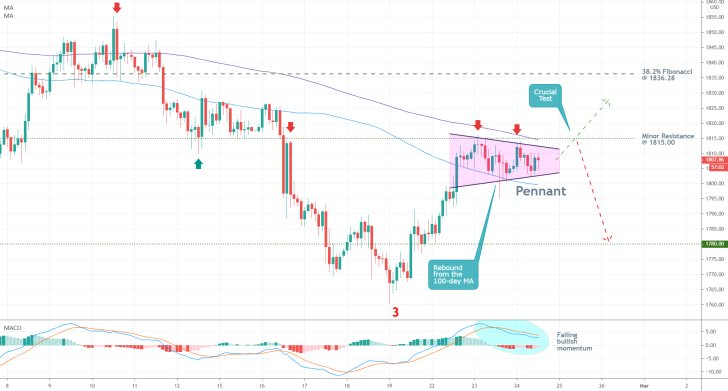
- The price of gold started behaving as per the expectations of the analysis. It reached the minor resistance at 1815.00 on two separate occasions following the publication of the analysis and is currently developing a Pennant pattern. Pennants typically entail likely trend continuation, so bears should be cautious of potential upswings above the resistance.
- For the time being, the price action remains concentrated between the 200-day MA (in purple) and the 100-day MA (in blue). As mentioned in the analysis, unless the price action manages to break out above 1815.00 decidedly, bears would have a chance to go short on the rebound (breakdown below the Pennant). The 1780.00 support remains the first target.
- The MACD indicator confirms the rising bearish momentum in the short-term.
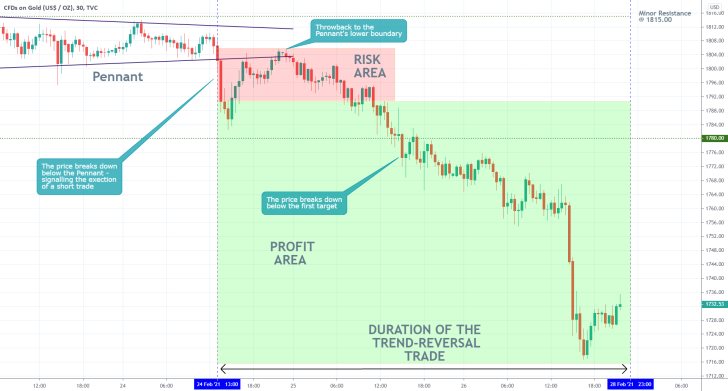
- A successful execution of a trend-reversal trade. The last follow-up correctly forecasted a breakout below the Pennant, which signified the beginning of a new downtrend. Notice that following the breakdown, the price action developed a throwback to the Pennant's lower boundary from below. Contrarian traders should be aware of the possibility of such adverse retracements every time they trade on reversal plays.
- The price action could possibly establish another minor pullback before the downtrend is resumed. The 61.8 per cent Fibonacci retracement level at 1690.28, as demonstrated on the initial analysis, encompasses the next target for the downtrend.
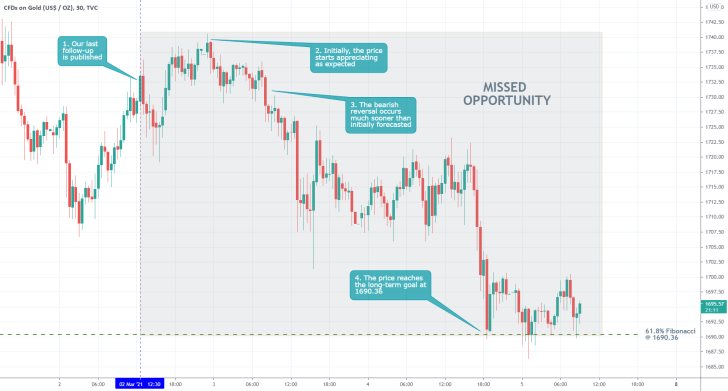
- Even though no losses were incurred on the above setup, the longer-term trade is considered a failure because an excellent opportunity was missed. The last follow-up anticipated the bullish pullback to extend as far as the 1780.00 resistance, but the correction was exhausted much sooner than that.
- Traders need to keep in mind that corrections and pullbacks tend to be much less predictable than broader trends, which is why they should be more lenient in their expectations of such formations. Namely, traders looking to utilise trend continuation strategies at the end of such corrections/pullbacks need to be ready to react to abrupt terminations of such formations (sooner than initially expected).
Disclaimer: Your capital is at risk! Trading and investing on the financial markets carries a significant risk of loss. Each material, shown on this website, is provided for educational purposes only. A perfect, 100% accurate method of analysis does not exist. If you make a decision to trade or invest, based on the information from this website, you will be doing it at your own risk. Under no circumstances is Trendsharks responsible for any capital losses or damages you might suffer, while using the company’s products and services. For more information read our Terms & Conditions and Risk Disclaimer.


