Despite the recent resurgence of confirmed COVID-19 cases globally, investors' sentiment seems to be improving. This tendency is supported by the robust performance of US banks, which was revealed by FED's stress tests.
While severe uncertainty continues to weigh down on the prospects for global recovery, the underlying economic conditions seem to be stabilising. Such a welcoming development, in turn, lessens investors' demand for safe-haven assets and low-risk securities. This is the baseline argument, which anticipates the greenback to depreciate in the immediate future.
In contrast, the New Zealand dollar was temporarily pressured last week when the RBNZ cautioned against unfavourable exchange rates. However, this is unlikely to have long-lasting consequences for the kiwi, which has been performing quite well against the greenback over the last couple of weeks.
The NZDUSD initiated developing a new bullish trend but is presently undergoing through muted price action. The pair appears to be forming a bullish flag pattern, which entails the continuation of the bullish trend' establishment. That is why the purpose of today's analysis is to examine the underlying market setup, and to underpin the conditions under which the NZDUSD would continue to appreciate after the flag is completed.
1. Long-Term Outlook:
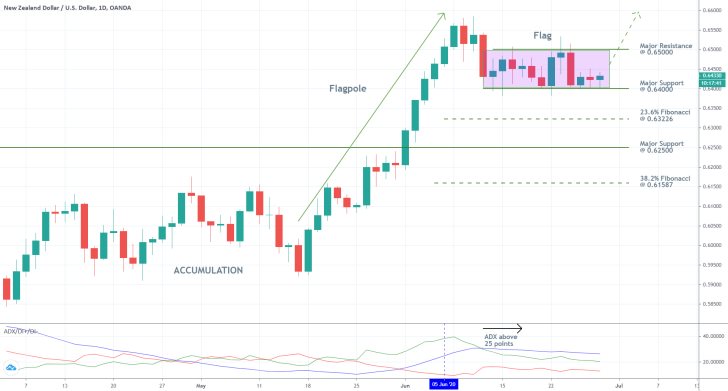
As can be seen on the daily chart below, the flag pattern represents a narrow consolidation range. Its upper boundary is represented by the major resistance level at 0.65000, and its lower boundary is encompassed by the major support level at 0.064000. The size of the range is precisely 100 pips, which confirms the fractal nature of the market. This means that the price action is not being quite erratic at present, and these conditions favour the execution of long trading orders.
If the NZDUSD manages to break out above the range's upper limit, this would mean that the bullish flag setup would be realised. Consequently, bullish traders would be able to catch the next uptrend, which would be established north to the 0.64000 resistance.
Conversely, if the underlying fundamentals change in the meantime and the price action breaks down below the range's lower limit, this would entail the likely emergence of a new downswing instead. In this case, the first target level for such a newly developing downtrend would be encapsulated by the 23.6 per cent Fibonacci retracement level at 0.63226. The second target level is represented by the major support level at 0.62500.

It should also be mentioned that the ADX indicator has been threading above the 25-point benchmark since the 5th of June, which means that the market is currently trending. Even though the underlying trending environment is not particularly robust, the observed conditions are still favourable for the successful development of the bullish flag pattern.
2. Short-Term Outlook:
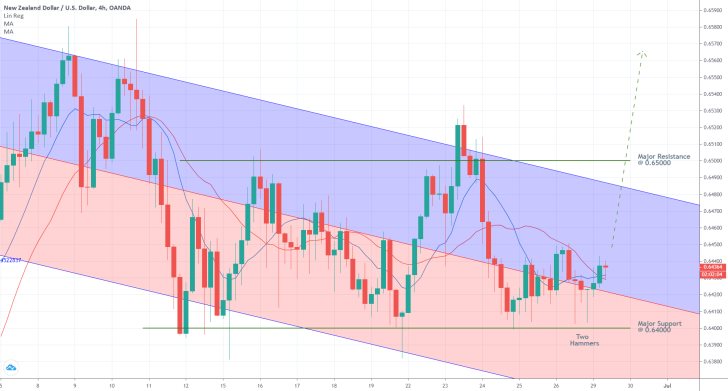
The aforementioned 'flag' segment of the broader pattern could also be represented using the downwards-sloping channel, which is drawn on the 4H chart below. As can be seen, the price action has recently broken out above the channel's middle line, which entails rising bullish commitment in the short-term.
This has happened immediately following the termination of the third attempt at a breakdown below the major support level at 0.64000. It follows that the market is indeed preparing to establish a new upswing.
The primary expectations are further substantiated by the fact that the two highlighted hammers have occurred above the aforementioned support. These candlesticks are typically found towards the lower end of a bearish downswing, and entail a potential reversal in the underlying direction of the price action.
Finally, the 20-day MA (in red) has recently crossed below the 10-day MA (in blue), and the two moving averages are positioned below the current market price. This represents yet another significant indication that the previous downswing is now terminated, and that the market is preparing to start climbing once again.

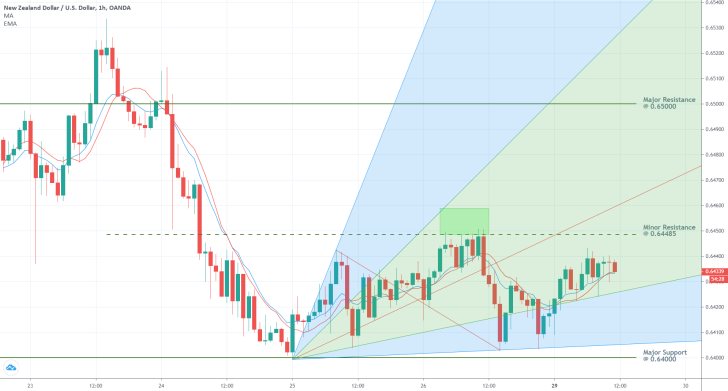
As can be seen on the hourly chart below, the underlying price action is currently threading in the middle portion of the pitchfan tool, which confirms the gradually rising bullish sentiment. Accordingly, the 10-day EMA (in blue) has crossed above the 10-day MA (in red).
If the NZDUSD manages to break out above the minor resistance level at 0.64485 and the pitchfan's middle line (represented as a red line), this will manifest quite a substantial piece of evidence in support of the initial expectations. The market bulls can use this as a potential entry signal.

3. Concluding Remarks:
The fundamental factors that were underpinned in the opening seem to support the expectations for the successful development of the aforementioned flag pattern. These underlying conditions are suitable for the execution of long trading orders - either at the current market price or above the minor resistance level at 0.64485. However, traders should be careful, because the possibility for a trend reversal is still present.
Keep in mind that this Friday is a Bank Holiday in the US, ahead of the 4th of July celebrations (the country's Independence Day). This entails muted price action on all currency pairs involving the greenback, due to the low trading volumes that are probably going to be executed towards the end of the week. Hence, traders should be cautious when trading the NZDUSD. They need to prepare for the likely emergence of erratic price fluctuations coupled with low-liquidity levels on Friday.
Disclaimer: Your capital is at risk! Trading and investing on the financial markets carries a significant risk of loss. Each material, shown on this website, is provided for educational purposes only. A perfect, 100% accurate method of analysis does not exist. If you make a decision to trade or invest, based on the information from this website, you will be doing it at your own risk. Under no circumstances is Trendsharks responsible for any capital losses or damages you might suffer, while using the company’s products and services. For more information read our Terms & Conditions and Risk Disclaimer.


